HPTLC Fingerprinting for Standardization of Bioactive Antimicrobial Compounds: A Comprehensive Guide for Pharmaceutical Analysis
This article provides a comprehensive examination of High-Performance Thin-Layer Chromatography (HPTLC) as a robust analytical tool for standardizing bioactive antimicrobial compounds from natural products.
HPTLC Fingerprinting for Standardization of Bioactive Antimicrobial Compounds: A Comprehensive Guide for Pharmaceutical Analysis
Abstract
This article provides a comprehensive examination of High-Performance Thin-Layer Chromatography (HPTLC) as a robust analytical tool for standardizing bioactive antimicrobial compounds from natural products. Targeting researchers, scientists, and drug development professionals, it covers foundational principles, methodological applications, troubleshooting approaches, and validation protocols. The content explores HPTLC's advantages in quality control, including its cost-effectiveness, high throughput capabilities, and compatibility with bioautography for direct antimicrobial activity detection. By integrating recent research findings and standardized procedures, this guide serves as a practical resource for ensuring reproducibility, safety, and efficacy in the development of herbal antimicrobial formulations, addressing the growing need for reliable standardization methods in natural product research.
Fundamentals of HPTLC Fingerprinting for Antimicrobial Compound Analysis
Principles and Advantages of HPTLC in Natural Product Standardization
In the field of natural product research, the standardization of complex botanical extracts is paramount to ensure their quality, efficacy, and safety. High-performance thin layer chromatography (HPTLC) has emerged as a powerful, sophisticated instrumental technique ideally suited for this task. Based on the full capabilities of thin layer chromatography, HPTLC provides a robust, simple, rapid, and efficient tool for the quantitative and qualitative analysis of complex mixtures found in pharmaceuticals, natural products, and clinical samples [1]. For researchers focusing on bioactive antimicrobial compounds from natural sources, HPTLC offers a unique combination of flexibility, cost-efficiency, and the ability to generate characteristic fingerprints that serve as chemical signatures for authentication and quality control purposes.
Core Principles of HPTLC
HPTLC operates on the same fundamental principles as classical TLC but incorporates significant enhancements that dramatically improve its analytical performance. The technique involves the separation of components in a mixture based on their differential partitioning between a stationary phase and a mobile phase.
Enhanced Stationary Phases
A key advancement in HPTLC is the use of higher quality TLC plates with finer, more uniform particle sizes (typically 5-7 μm) in the stationary phase, which allows for better resolution and separation efficiency. These plates are typically composed of silica gel GF254, though other modified sorbents are also available for specific applications [1] [2]. The particle size and distribution are optimized to provide a more homogeneous layer, resulting in improved reproducibility and sharper separation zones.
Automated Sample Application
HPTLC utilizes automated sample applicators such as the Camag Linomat V, which enables precise, reproducible application of samples as narrow bands rather than spots. This automated application significantly enhances resolution, quantitative accuracy, and the overall reproducibility of the analysis [2].
Advanced Development Techniques
The separation can be further improved by controlled development in automated developing chambers and by repeated development of the plate using a multiple development device. These controlled conditions minimize the influence of environmental factors and contribute to the high reproducibility of HPTLC methods [1].
Sophisticated Detection and Documentation
Visual detection is suitable for qualitative analysis, but HPTLC offers a range of more specific detection methods for quantitative analysis and structural information. These include UV, diode-array and fluorescence spectroscopy, mass spectrometry (MS), Fourier-transform infrared (FTIR), and Raman spectroscopy, all of which have been applied for the in situ detection of analyte zones on a TLC plate [1]. The results can be documented as images, providing a permanent record of the analysis.
Key Advantages of HPTLC in Natural Product Standardization
HPTLC offers numerous distinct advantages that make it particularly valuable for the standardization of natural products, especially when researching bioactive antimicrobial compounds.
Table 1: Advantages of HPTLC in Natural Product Analysis
| Advantage | Description | Relevance to Natural Products |
|---|---|---|
| High Sample Throughput | Parallel analysis of multiple samples on the same plate [1] | Rapid screening of numerous plant extracts or fractions |
| Minimal Sample Preparation | Requires less extensive clean-up compared to other chromatographic methods [1] | Ideal for complex plant matrices containing multiple compound classes |
| Cost-Efficiency | Lower operational costs due to minimal solvent consumption and reusable plates | Economical for routine analysis in quality control laboratories |
| Multiple Detection Options | Sequential application of different derivatization reagents on the same plate [3] | Comprehensive profiling of various phytochemicals with different chemical properties |
| Image-Based Results | Ability to present results as an image providing visual fingerprint [1] | Easy comparison of sample profiles against reference standards |
| Flexibility in Analysis | Open chromatographic system allowing post-chromatographic derivatization [4] | Enhanced detection of specific compound classes through chemical reactions |
HPTLC has established itself as the method of choice for handling complex analytical tasks involving herbal drugs and botanicals. The unique combination of state-of-art instrumentation, standardized procedures, and solid theoretical foundations enables it to deliver reliable, cGMP-compliant results time after time [1]. It remains one of the most flexible, reliable, and cost-efficient separation techniques ideally suited for the analysis of botanicals and herbal drugs, guaranteeing reproducible results—a vital element in the routine identification of complex fingerprints of plant extracts and pharmaceutical products [1].
For antimicrobial research specifically, HPTLC enables the correlation of specific compound bands with antimicrobial activity through bioautography, where the developed plate is incubated with microbial cultures to detect zones of inhibition. This direct linking of chemical profiles with biological activity is particularly valuable in natural product drug discovery.
Applications in Standardization of Antimicrobial Natural Products
The application of HPTLC in standardizing natural products with antimicrobial potential is well-established in scientific literature. The technique serves multiple purposes from authentication to quantification of active markers.
Fingerprinting for Authentication and Quality Control
HPTLC fingerprinting generates characteristic patterns that serve as chemical signatures for herbal materials. This is particularly important for establishing the identity and purity of antimicrobial plant extracts. A recent study established characteristic HPTLC fingerprints for rooibos (Aspalathus linearis) and honeybush (Cyclopia species) teas, allowing for their authentication and quality control. The optimized method provided adequate resolution and clearly visible bands for phenolic compounds including orientin, vitexin, rutin, quercetin, mangiferin, and isomangiferin, which can serve as marker compounds [3].
Quantification of Bioactive Compounds
HPTLC, when coupled with densitometry, provides accurate quantification of antimicrobial compounds in natural products. The analysis of Nymphaea nouchali seeds, used in traditional medicine for infections, demonstrated this application effectively. Researchers developed and validated an HPTLC method to quantify three phenolic compounds with known antimicrobial activity: catechin (3.06%), gallic acid (0.27%), and quercetin (0.04%) [2]. The high catechin content correlated with the significant antimicrobial activity observed against pathogens including Pseudomonas aeruginosa, Staphylococcus aureus, and Candida albicans [2].
Table 2: HPTLC Analysis of Antimicrobial Compounds in Natural Products
| Natural Product | Bioactive Compounds Quantified | Antimicrobial Activity Correlated | Reference |
|---|---|---|---|
| Nymphaea nouchali seeds | Catechin (3.06%), Gallic acid (0.27%), Quercetin (0.04%) | Effective against P. aeruginosa, S. aureus, C. albicans [2] | [2] |
| Photinia integrifolia root bark | Diterpenoids (1β,3α,8β-trihydroxy-pimara-15-ene, 6α,11,12,16-tetrahydroxy-7-oxo-abieta-8,11,13-triene, 2α,19-dihydroxy-pimara-7,15-diene) | Chemical markers for standardization [1] | [1] |
| Bamboo-leaf flavonoids | Isoorientin, isovitexin, orientin, vitexin | Standardization of commercial samples [1] | [1] |
Detection of Adulteration
HPTLC serves as an ideal screening tool for adulterations in natural products and is highly suitable for evaluating and monitoring cultivation, harvesting, and extraction processes [1]. The CAMAG application notes include methods for "Detecting adulteration with olive leaves in oregano herb" and "Detection of paraffin oil in milk," demonstrating the versatility of HPTLC in detecting various types of adulteration [4].
Experimental Protocols for HPTLC Fingerprinting
This section provides a detailed methodology for developing HPTLC fingerprints of natural products with antimicrobial properties, based on established protocols from the literature.
Sample Preparation Protocol
- Plant Material Processing: Reduce the dried plant material to a coarse powder using a mechanical grinder.
- Extraction: Weigh approximately 2.0 g of the powdered material and extract with 20 mL of 70% ethanol using a Soxhlet apparatus at 50°C for 6 hours [2].
- Concentration: Evaporate the extract to dryness using a rotary evaporator at 50°C.
- Reconstitution: Dissolve the residue in 10 mL of methanol and filter through a 0.45 μm membrane filter before application on HPTLC plates.
HPTLC Analysis Protocol
- Stationary Phase: Use pre-coated silica gel GF254 HPTLC plates (20 × 10 cm) [2].
- Sample Application: Apply samples and standards as bands (8 mm in length) using an automated TLC sample spotter (e.g., Camag Linomat V) at a constant application rate of 150 nL/s [2].
- Chromatographic Development: Develop the plates in a Camag glass twin-trough chamber previously saturated with the mobile phase for 20 minutes. The mobile phase should be optimized for the specific natural product under investigation. For phenolic compounds, a suitable system is chloroform:ethyl acetate:formic acid:methanol (2.5:2:0.4:0.2, v/v/v/v) [2].
- Development Distance: Allow the mobile phase to migrate vertically to a distance of 80 mm from the point of application.
- Drying: Air-dry the developed plates in a fume hood.
Derivatization and Detection
- Visualization Reagents: Use appropriate derivatization reagents such as:
- Derivatization Method: Dip the developed and dried plates in the derivatization reagent for 2 seconds, then heat at 100°C for 3-5 minutes to develop the colors.
- Documentation: Capture the images under white light, UV light at 254 nm, and UV light at 366 nm using a documentation system.
- Densitometric Scanning: For quantification, perform densitometric scanning at appropriate wavelengths (e.g., 412 nm for quercetin) [2].
Method Validation
For quantitative analysis, validate the HPTLC method according to International Conference on Harmonization (ICH) guidelines for:
- Linearity (e.g., concentration range of 100-1000 ng/band for standards)
- Precision (intra-day and inter-day relative standard deviation <2%)
- Accuracy (recovery studies 98-102%)
- Robustness (deliberate variations in mobile phase composition, development distance, etc.)
- Limit of Detection (LOD) and Limit of Quantification (LOQ) [1]
Essential Research Reagent Solutions
Successful HPTLC analysis requires specific reagents and materials to ensure reproducible and accurate results. The following table outlines key reagents and their functions in HPTLC workflow for natural product standardization.
Table 3: Essential Research Reagents for HPTLC Analysis of Natural Products
| Reagent/Material | Function in HPTLC Analysis | Application Example |
|---|---|---|
| Silica gel GF254 plates | Stationary phase for chromatographic separation | Standard matrix for most natural product separations [2] |
| Natural Product (NP) reagent | Derivatization for visualization of flavonoids | Detection of quercetin, orientin, vitexin in plant extracts [3] |
| p-Anisaldehyde sulfuric acid reagent | Universal derivatization for various phytochemicals | Visualization of terpenes, steroids, and other compounds [3] |
| Methanol, Ethanol | Extraction solvents for plant materials | Preparation of plant extracts prior to HPTLC analysis [2] |
| Chloroform, Ethyl Acetate, Formic Acid | Components of mobile phase systems | Separation of phenolic compounds in antimicrobial plants [2] |
| Standard compounds (e.g., quercetin, gallic acid, catechin) | Reference markers for identification and quantification | Quantification of antimicrobial phenolics in Nymphaea nouchali [2] |
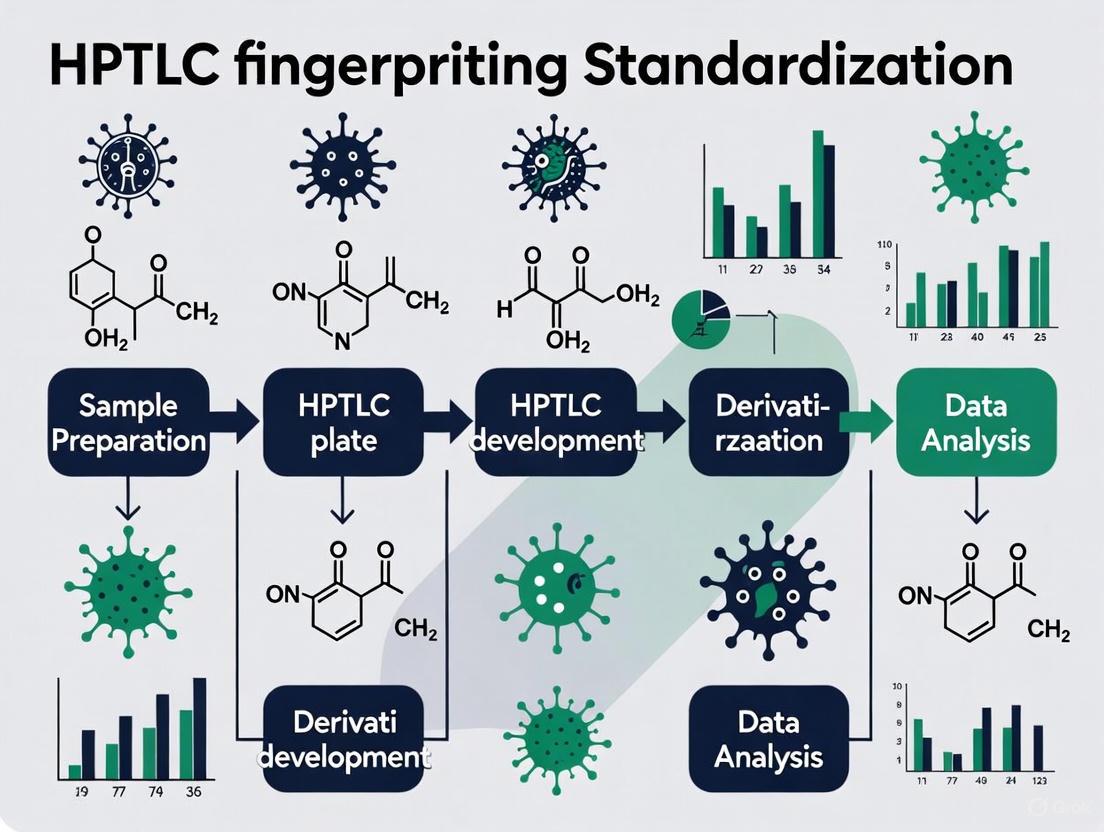
Workflow Visualization
The following diagram illustrates the complete HPTLC workflow for natural product standardization, from sample preparation to documentation and analysis:
HPTLC Standardization Workflow
HPTLC represents a powerful, versatile, and cost-effective analytical platform for the standardization of natural products, particularly those with antimicrobial properties. Its unique advantages including high sample throughput, minimal sample preparation, multiple detection capabilities, and the ability to generate visual fingerprints make it an indispensable tool in natural product research. The principles of enhanced stationary phases, automated sample application, controlled development, and sophisticated detection methods underpin its superior performance compared to traditional TLC. As demonstrated in various applications, HPTLC enables researchers to establish characteristic fingerprints, quantify bioactive markers, detect adulteration, and correlate chemical profiles with biological activity—all essential components of a comprehensive standardization strategy for antimicrobial natural products.
High-performance thin-layer chromatography (HPTLC) is a sophisticated, robust, simple, rapid, and efficient analytical technique widely employed for the separation, identification, and quantification of non-volatile compounds [5]. As an advanced form of thin-layer chromatography (TLC), HPTLC utilizes stationary phases with finer particle sizes, leading to superior resolution, enhanced compound separation, and lower limits of detection (LOD) [5] [1]. This technique is particularly valuable in pharmaceutical and natural product research for its ability to provide chromatographic fingerprints, which are essential for the standardization of complex mixtures such as plant extracts containing bioactive antimicrobial compounds [6] [1]. For researchers focused on drug discovery, HPTLC offers unique advantages including minimal sample preparation, high sample throughput, and the possibility of multiple detection methods and hyphenation [5] [1]. This application note details validated HPTLC methodologies for the analysis of three key classes of bioactive compounds—alkaloids, flavonoids, and terpenoids—within the context of antimicrobial compound research and development.
HPTLC Fundamentals and Relevance to Bioactive Compound Analysis
HPTLC operates on the same fundamental principles as TLC but with enhancements that significantly improve its analytical performance. The three primary modes of HPTLC are linear, circular, and anticircular, with the anticircular mode being the fastest and most cost-effective, offering superior separation and sensitivity, especially at higher Rf values [5]. The technique is highly regarded for its flexibility, reliability, and cost-efficiency, making it an ideal choice for generating reproducible fingerprints of botanicals and herbal drugs [1]. A key strength in bioactive compound research is its ability to combine chromatographic separation with effect-directed detection using biological assays, thereby helping researchers select important compounds from complex samples for further characterization [5]. The following diagram illustrates a generalized HPTLC workflow for bioactive compound analysis.
Analysis of Key Bioactive Compound Classes
Alkaloids
Alkaloids are nitrogen-containing secondary metabolites with demonstrated antimicrobial properties. HPTLC provides a rapid and reliable method for their profiling and quantification in complex matrices.
Protocol: HPTLC Analysis of Ephedrine Alkaloids [7]
- Stationary Phase: Silica gel 60 F254 HPTLC plates.
- Sample Preparation: Ultrasonicate 1 g of powdered plant material with 10 mL of methanol/water (2:1, v/v) for 15 minutes. Filter the extract before application.
- Application: Apply 10 µL of standard and sample solutions as 8-mm bands using an automated sampler (e.g., CAMAG Linomat 5).
- Mobile Phase: Ammonia/methanol/dichloromethane (1:10:40, v/v/v).
- Development: Develop the plate in a twin-trough chamber pre-saturated with the mobile phase for 20 minutes. The development distance is 80 mm.
- Derivatization: Spray the developed plate with ninhydrin reagent (0.2% in ethanol) and heat at 105°C for 5-10 minutes until violet-colored bands appear.
- Detection & Quantification: Scan the plate densitometrically at 500 nm. Identify ephedrine by comparing its Rf value and UV spectrum with a reference standard.
Application Note: A validated HPTLC method for ephedrine alkaloids demonstrated a linearity range of 0.062-0.146 µg/band, with an LOD of 0.0020 µg/band and LOQ of 0.0067 µg/band [7]. This method allows for the simultaneous screening of up to 19 samples on a single plate, making it highly efficient for quality control.
Flavonoids
Flavonoids are polyphenolic compounds known for their broad-spectrum antimicrobial and antioxidant activities. HPTLC is particularly effective for their fingerprinting and quantification.
Protocol: HPTLC Analysis of Flavonoids using Derivatization [6] [8]
- Stationary Phase: Silica gel 60 F254 HPTLC plates.
- Sample Preparation: Extract 1 g of powdered leaf or flower material with 10 mL of methanol using ultrasound-assisted extraction for 15-20 minutes. Filter before use.
- Application: Apply standard and sample solutions as bands.
- Mobile Phase (for flavonoid separation): Toluene : ethyl acetate : formic acid : methanol (20:12:8:4, v/v/v/v).
- Development: Develop the plate in a saturated twin-trough chamber.
- Derivatization:
- AlCl3 Method: Spray the plate with a 2% ethanolic AlCl3 solution. Heat at 100°C for 1-2 minutes. Observe under UV 366 nm.
- NaNO2-AlCl3-NaOH Method: Sequentially spray with NaNO2, AlCl3, and NaOH solutions [8].
- Detection: Document the plate under UV light at 366 nm before and after derivatization. Perform densitometric scanning at the respective λmax (typically 370-420 nm after AlCl3 derivatization).
Application Note: Derivatization with AlCl3 causes bathochromic shifts in the absorbance maxima of most flavonoids, enabling their selective detection. This method helps visualize individual flavonoids, complementing the total flavonoid content assay and aiding in the authentication of antimicrobial plant extracts [8].
Terpenoids
Terpenoids constitute a large class of natural products with significant antimicrobial and anti-inflammatory activities. HPTLC fingerprinting is valuable for their chemotaxonomic and standardization studies.
Protocol: HPTLC for Chemotaxonomic Investigation of Terpenoids [9]
- Stationary Phase: Aluminum sheets coated with silica gel 60 F254.
- Sample Preparation: Extract plant material (e.g., bark) with an appropriate solvent like methanol or dichloromethane.
- Application: Apply crude extracts and standards as bands using an automated sampler.
- Mobile Phase: Optimize based on the terpenoid class under investigation. Common systems include hexane-ethyl acetate or toluene-ethyl acetate mixtures in varying ratios.
- Development: Develop the plate in a flat-bottom or twin-trough chamber.
- Detection: Document the plate under UV 254 nm and 366 nm. Derivatize with specific reagents like anisaldehyde-sulfuric acid or vanillin-sulfuric acid, followed by heating, to visualize terpenoids as colored zones.
- Data Analysis: Use chemometric tools like Principal Component Analysis (PCA) and Hierarchical Cluster Analysis (HCA) to classify plant species based on their terpenoid profiles.
Application Note: HPTLC, combined with chemometric analysis, is a powerful strategy for identifying chemotypes within plant species based on variations in their terpenoid content. This integrated approach confirms the presence of chemotypes and identifies potential phytomarkers of taxonomic and therapeutic importance [9].
Table 1: Summary of HPTLC Conditions for Key Bioactive Compound Classes
| Parameter | Alkaloids (e.g., Ephedrine) [7] | Flavonoids [6] [8] | Terpenoids [9] |
|---|---|---|---|
| Stationary Phase | Silica gel 60 F254 | Silica gel 60 F254 | Silica gel 60 F254 |
| Sample Application | Automated, 10 µL as bands | Automated band application | Automated band application |
| Mobile Phase | NH3/MeOH/DCM (1:10:40, v/v/v) | Toluene:EtOAc:FA:MeOH (20:12:8:4, v/v) | Hexane:EtOAc or similar |
| Derivatization | Ninhydrin reagent, heating | AlCl3 or NaNO2-AlCl3-NaOH | Anisaldehyde-H2SO4, heating |
| Detection | Densitometry at 500 nm | UV 366 nm, densitometry at ~400 nm | Visible light, UV 366 nm |
| Linearity Range | 0.062 - 0.146 µg/band | Compound-dependent | - |
| LOD/LOQ | 0.0020 / 0.0067 µg/band | Compound-dependent | - |
Table 2: Research Reagent Solutions for HPTLC Analysis
| Reagent / Material | Function in HPTLC Analysis |
|---|---|
| HPTLC Plates (Silica gel 60 F254) [5] | The stationary phase for compound separation; the F254 indicator fluoresces under UV 254 nm for compound visualization. |
| Automated Sample Applicator (e.g., CAMAG Linomat 5) [5] | Provides precise, automated sample application as narrow bands, enhancing resolution and reproducibility. |
| Twin-Trough Development Chamber [5] | A saturated chamber for chromatogram development, ensuring reproducible and optimal separation conditions. |
| Aluminium Chloride (AlCl3) Reagent (2%) [8] | Derivatization agent for flavonoids; forms acid-stable complexes, causing bathochromic shifts for selective detection. |
| Ninhydrin Reagent (0.2%) [7] | Derivatization agent for primary amine-containing compounds like certain alkaloids (e.g., ephedrine), producing colored derivatives. |
| Anisaldehyde-Sulfuric Acid Reagent [9] | A general derivatization reagent for terpenoids, producing characteristic colors upon heating. |
| HPTLC Densitometer Scanner (e.g., CAMAG TLC Scanner 4) [9] | Enables in-situ quantification and spectral analysis of separated bands directly on the plate. |
Advanced Applications and Hyphenation
HPTLC's versatility is greatly enhanced by its compatibility with advanced data analysis and hyphenation techniques. For antimicrobial research, combining HPTLC with effect-directed analysis (EDA) allows for the direct correlation of separated chemical bands with biological activity, such as antibacterial or antifungal effects [5] [6]. Furthermore, hyphenation with techniques like mass spectrometry (HPTLC-MS) or Fourier-transform infrared spectroscopy (HPTLC-FTIR) provides structural information for the unequivocal identification of antimicrobial compounds [5] [10]. The application of chemometric analysis (e.g., PCA, HCA) to HPTLC densitometric profiles enables the classification of plant species based on their metabolite fingerprints and the identification of chemotypes, which is crucial for ensuring the consistent quality of raw materials used in drug development [9]. The logical pathway from screening to compound identification is summarized below.
HPTLC has established itself as a powerful, versatile, and cost-effective analytical platform for the standardization of bioactive antimicrobial compounds from natural sources. Its ability to provide high-resolution chromatographic fingerprints for alkaloids, flavonoids, and terpenoids—coupled with options for facile derivatization, precise quantification, and advanced hyphenation—makes it an indispensable tool in the modern researcher's arsenal. The detailed protocols and application notes provided herein offer a solid foundation for scientists and drug development professionals to implement HPTLC in their workflows for the reliable and reproducible analysis of complex plant-derived formulations aimed at combating microbial infections.
Within the pipeline for antimicrobial drug discovery, particularly from complex natural products, the choice of analytical technique is pivotal. High-Performance Thin-Layer Chromatography (HPTLC) has emerged as a powerful, versatile platform that addresses specific challenges in the screening and standardization of antimicrobial compounds. Unlike methods that provide only chemical data, HPTLC uniquely integrates chemical separation with direct biological activity detection, offering a functional perspective essential for identifying genuine bioactive constituents. This application note details the comparative advantages of HPTLC and provides established protocols for its use in antimicrobial screening, supporting the broader thesis that HPTLC fingerprinting is a robust methodology for standardizing bioactive antimicrobial compounds.
Comparative Analysis: HPTLC Versus Other Chromatographic Techniques
The selection of an analytical method balances throughput, cost, information depth, and applicability to biological screening. The table below provides a structured comparison of HPTLC with other common chromatographic methods in the context of antimicrobial compound research.
Table 1: Quantitative comparison of chromatographic techniques for antimicrobial screening
| Feature | HPTLC | HPLC | GC-MS | LC-MS |
|---|---|---|---|---|
| Analysis Time | 5–15 minutes for multiple samples [11] | Often >30 minutes per sample [11] | 15-60 minutes per sample | 15-60 minutes per sample |
| Sample Throughput | High (parallel analysis of up to 20 samples/plate) [11] | Low (sequential analysis) | Low (sequential analysis) | Low (sequential analysis) |
| Solvent Consumption | Low (<10 mL per run) [11] | High (hundreds of mL to L/day) | Moderate | High |
| Sample Pretreatment | Minimal often required [11] | Often labor-intensive [11] | Can be complex | Can be complex |
| Direct Bioactivity Linking | Yes (via bioautography) | Indirect (fraction collection required) | No | Indirect |
| Detection Flexibility | Multiple: UV/Vis, MS, SERS, bioassay on same plate [11] | Typically single detector (e.g., DAD) | Mass spectrometry | Mass spectrometry |
| Cost per Analysis | Low | High | High | Very High |
| Key Advantage for Antimicrobial Screening | Direct, in-situ bioautography for activity-based profiling [12] | High resolution and precision for quantification | Excellent for volatile antimicrobials | Powerful identification of non-volatile compounds |
As illustrated, HPTLC offers distinct benefits in speed, cost-effectiveness, and environmental impact due to its low solvent consumption [11]. Its most significant advantage for antimicrobial discovery is the seamless integration with bioautography, a technique that allows for the direct localization of antibacterial or antifungal compounds on the chromatogram itself.
Core Experimental Protocols for Antimicrobial Screening via HPTLC
Protocol 1: HPTLC Fingerprinting and Bioautography
This protocol is designed to separate components of a complex extract, such as a polyherbal formulation, and identify those with antimicrobial activity [12].
Workflow Overview:
Materials and Reagents:
- HPTLC Plates: Silica gel 60 F254, 20x10 cm (e.g., Merck) [13].
- Sample: Methanolic extract of test material (e.g., polyherbal formulation) [12].
- Mobile Phase: Varies by sample; for example, Toluene: Ethyl acetate: Glacial acetic acid (4:5:1, v/v) [14].
- Microbial Strain: Test organisms like Staphylococcus aureus (Gram-positive) or Escherichia coli (Gram-negative) [12].
- Growth Medium: Mueller Hinton Agar (MHA) and Mueller Hinton Broth (MHB) [12].
- Visualization Reagent: Iodonitrotetrazolium chloride (INT) or MTT for dyeing microbial growth [12].
Procedure:
- Sample Application:
Chromatographic Development:
- Pour the mobile phase into a twin-trough chamber to a depth of about 5 mm.
- Saturate the chamber for 20-30 minutes at room temperature.
- Develop the plate to a distance of 70-80 mm from the point of application [14].
- Remove the plate and dry thoroughly in a fume hood.
Documentation:
- Capture the chromatogram under UV light at 254 nm and 366 nm, and under white light after derivatization, if applicable. This creates the initial chemical fingerprint.
Bioautography Assay:
- Direct Bioautography: Prepare a suspension of the test microorganism (e.g., S. aureus) in a suitable broth (MHB) and adjust to a turbidity of 10^8 CFU/mL (0.5 McFarland standard). Spray the inoculated medium evenly over the dried HPTLC plate. Incubate the plate in a humid chamber at 37°C for 18-24 hours [12].
- Visualization: Spray the plate with an INT solution (0.2 mg/mL). Living metabolically active bacteria reduce the yellow INT dye to pink-purple formazan. Clear, colorless zones against a colored background indicate inhibition of bacterial growth, corresponding to the location of antimicrobial compounds [12].
Protocol 2: HPTLC-MS for Compound Identification
Following bioautography, this protocol enables the direct identification of active compounds from the HPTLC plate.
Workflow Overview:
Materials and Reagents:
- HPTLC Plate: From Protocol 1, with active zones located.
- HPTLC-MS Interface: Commercial interface (e.g., Camag TLC-MS Interface).
- Extraction Solvent: A volatile solvent like methanol or methanol-water mixture, optimized for the target compound.
- Mass Spectrometer: LC-MS or HRMS system with electrospray ionization (ESI) source [16].
Procedure:
- Zone Selection: Precisely mark the active zones (inhibition zones) identified in the bioautography assay.
- Zone Extraction: Using the TLC-MS interface, the selected zone is sealed, and the analyte is eluted directly from the plate into the mass spectrometer using a steady flow of solvent (e.g., 0.2 mL/min methanol) [16].
- MS Analysis: The eluted compounds are ionized (typically via ESI) and analyzed by the mass spectrometer. This provides molecular mass and fragmentation data for structural elucidation [11] [16].
- Data Interpretation: Compare the mass spectra obtained with compound databases or standards to propose the identity of the antimicrobial agent.
The Scientist's Toolkit: Essential Research Reagents and Materials
Successful implementation of HPTLC-based antimicrobial screening relies on specific reagents and materials. The following table lists key solutions and their critical functions.
Table 2: Key research reagent solutions for HPTLC antimicrobial screening
| Reagent/Material | Function/Explanation | Example Use Case |
|---|---|---|
| Silica Gel 60 F254 Plates | Standard stationary phase for normal-phase separation. F254 indicates a fluorescent indicator for UV visualization. | Core matrix for separating components of herbal extracts [13] [14]. |
| Iodonitrotetrazolium Chloride (INT) | Vital dye used in bioautography. Metabolically active microbes reduce yellow INT to pink formazan. | Visualizing zones of inhibition; clear zones indicate antimicrobial activity [12]. |
| CAMAG TLC-MS Interface | Specialized device that enables direct elution of compound bands from the TLC plate into a mass spectrometer. | Directly coupling separation to structural identification of active compounds [11]. |
| Metal-Organic Frameworks (MOFs) | Advanced functional nanomaterials used to modify HPTLC plates to enhance selectivity and pre-concentration of target analytes. | Improving sensitivity for detecting trace-level contaminants or active compounds in complex matrices [11]. |
| HPTLC Derivatization Reagents | (e.g., Anisaldehyde-sulfuric acid, NP/PEG). Chemicals sprayed post-development to reveal specific compound classes via color reactions. | Visualizing non-UV active antimicrobial compounds like certain terpenes or phenolics [17]. |
HPTLC stands out as a highly effective platform for antimicrobial screening, offering a unique combination of rapid parallel analysis, minimal solvent consumption, and direct linkage to biological activity through bioautography. Its compatibility with advanced detection techniques like MS and SERS transforms it from a simple separation tool into a comprehensive analytical platform. For researchers standardizing antimicrobial compounds from complex sources, HPTLC fingerprinting provides an unparalleled blend of efficiency, cost-effectiveness, and functional insight, accelerating the path from crude extract to identified bioactive lead.
The World Health Organization (WHO) provides a comprehensive framework for ensuring the safety, efficacy, and quality of herbal products throughout their lifecycle, from cultivation to consumption [18]. These guidelines are particularly crucial given that approximately 80% of the global population relies on traditional medicine, including herbal remedies, for primary healthcare [19] [20]. The regulatory landscape incorporates pharmacopeial standards and Good Manufacturing Practices (GMP) to address the complex challenges of herbal medicine quality control, especially relevant for research on bioactive antimicrobial compounds [20].
For researchers focusing on HPTLC fingerprinting of antimicrobial compounds, understanding this regulatory framework is essential. The chemical complexity of plants—containing alkaloids, flavonoids, terpenoids, phenolics, and polysaccharides—necessitates robust standardization methodologies [18]. These bioactive compounds exhibit diverse pharmacological activities, including antimicrobial effects, which must be consistently standardized across batches to ensure reliable therapeutic outcomes [2] [18].
WHO Guidelines for Herbal Medicine Quality Control
Fundamental Quality Control Parameters
WHO emphasizes that quality control encompasses all procedures undertaken to ensure the identity and purity of a health product [21]. For herbal medicines, this begins with proper identification of botanicals through macroscopic, microscopic, and molecular methods to prevent misidentification and adulteration [19]. The raw materials must meet minimum quality criteria regarding moisture, foreign matter, and active constituents before processing [19].
The WHO's comprehensive approach extends through the entire manufacturing process, requiring validated extraction processes and analytical method verification through techniques like chromatographic fingerprinting [19]. For antimicrobial research, this ensures that the bioactive compounds under investigation are consistently present and measurable across different batches. Furthermore, WHO mandates stability testing to determine shelf life and appropriate storage conditions, crucial for maintaining the potency of antimicrobial compounds [19].
Good Manufacturing Practice Requirements
WHO's GMP guidelines for herbal medicines require that manufacturing processes be validated, equipment calibrated, and operations conducted by qualified personnel [19] [20]. These practices are fundamental for ensuring that research on antimicrobial compounds translates reliably from laboratory settings to commercial products. The guidelines emphasize quality control throughout production, including in-process testing and final product assessment [19].
Documentation practices including Batch Manufacturing Records are critical components that enable traceability and quality monitoring [19]. For researchers, adhering to these standards ensures that experimental results are reproducible and clinically relevant. The WHO also highlights the importance of quality records and audit trails for effective monitoring and regulatory oversight [19].
Pharmacopeial Standards and Global Harmonization
Comparative Analysis of Major Pharmacopeias
Table 1: Key Pharmacopeial Standards for Herbal Medicines
| Pharmacopeia | Regional Focus | Standardization Approach | Key Features |
|---|---|---|---|
| U.S. Pharmacopeia (USP) | United States, recognized in >140 countries [22] | Identity, strength, quality, purity [22] | Botanical dietary supplements compendium [22] |
| European Pharmacopoeia | European Union [20] | Quality control of traditional Chinese medicine [20] | Harmonized standards across member states [20] |
| National Pharmacopeias | China, Japan, South Korea, Vietnam [20] | Based on traditional practices [20] | Reflect unique cultural and historical contexts [20] |
| Herbal Medicines Compendium (HMC) | Global [22] | Quality standards for traditional herbal medicines [22] | Publicly available standards [22] |
A global comparative analysis reveals significant variations in how different regions define and regulate herbal medicines [20]. These differences are influenced by national legal frameworks, regulatory requirements, and unique cultural influences [20]. For researchers conducting multi-center studies or developing products for international markets, understanding these distinctions is essential for protocol development and regulatory compliance.
The United States Pharmacopeia (USP), founded in 1820, provides processes and guidance to ensure medicines meet well-defined standards for safety and efficacy [22]. USP standards are legally recognized by more than 40 countries and used in over 140 countries [22]. The USP maintains several compendia specifically for botanicals, including the Dietary Supplements Compendium and the Herbal Medicines Compendium [22].
Harmonization Efforts
Despite regional variations, significant efforts toward international harmonization are underway. Organizations like the Forum on the Harmonization of Herbal Medicines (FHH) work to align standards across regions [20]. The WHO plays a crucial role in this harmonization through the development of global guidelines and technical support to member states [19] [18].
For researchers focusing on antimicrobial compounds from herbal medicines, this harmonization is particularly important for establishing globally accepted testing protocols and quality parameters. The WHO utilizes ISO standards for ensuring quality and test methods, along with Codex Alimentarius guidelines for herbal food supplements [19].
HPTLC Fingerprinting for Standardization of Bioactive Antimicrobial Compounds
Regulatory Basis for HPTLC in Quality Control
High-Performance Thin-Layer Chromatography plays a crucial role in establishing the chemical fingerprint of natural products during analysis [23]. Regulatory authorities worldwide recognize chromatographic fingerprinting as a valid approach for quality evaluation of herbal medicines [24]. The WHO specifically mentions TLC among the chemical experiments used to determine identity and screen for particular pharmaceutical substances [21].
The HPTLC Association maintains a collection of more than 300 methods for the identification of herbal drugs and herbal drug preparations, many of which have been adopted in monographs published by the European and United States Pharmacopeias [25]. These methods follow the Association's Standard Operating Procedure, ensuring reproducibility of results [25]. For antimicrobial research, this standardized approach allows for consistent profiling of bioactive compounds across different laboratories and study sites.
Advanced HPTLC Methodologies for Antimicrobial Compounds
Recent research demonstrates the application of HPTLC for profiling antimicrobial compounds in complex matrices. For example, a 2024 study on Nymphaea nouchali seeds used HPTLC to identify and quantify phenolic compounds, including catechin (3.06%), gallic acid (0.27%), and quercetin (0.04%), correlating these compounds with antimicrobial activity [2]. The method employed a Camag TLC system with chloroform:ethyl acetate:formic acid:methanol (2.5:2:0.4:0.2, v/v/v/v) as the mobile phase and densitometric scanning at 412 nm [2].
A novel strategy for quality evaluation of complex herbal preparations based on multi-color scale and efficacy-oriented HPTLC characteristic fingerprint combined with chemometric methods has been developed for comprehensive quality control [24]. This approach establishes highly specific characteristic fingerprints for each herbal medicine in a preparation, eliminating interference from other herbs and ensuring accuracy [24]. For antimicrobial research, this enables targeted analysis of specific bioactive compounds within complex mixtures.
Validated HPTLC Methods for Regulatory Compliance
Table 2: HPTLC Validation Parameters as per ICH Guidelines
| Parameter | Requirements | Application Example |
|---|---|---|
| Linearity | Specific range with correlation coefficient [13] | 0.03–3.00 µg/band for meloxicam, 0.50–9.00 µg/band for Florfenicol [13] |
| Detection | Densitometric at specific wavelengths [13] | 230 nm for Florfenicol and Meloxicam [13] |
| Mobile Phase | Optimized solvent system [13] | Glacial acetic acid:methanol:triethylamine:ethyl acetate (0.05:1.00:0.10:9.00) [13] |
| System Suitability | Must be met on individual HPTLC plate [25] | Appropriate fingerprint for identity standard [25] |
Regulatory-compliant HPTLC methods require validation according to ICH guidelines [13]. A 2025 study developed an FDA-validated ecofriendly HPTLC method for quantification of antimicrobial compounds, demonstrating linearity within specified ranges and using densitometric detection at 230 nm [13]. The method employed Esomeprazole as an internal standard to compensate for potential wavelength fluctuations [13].
The environmental impact of analytical methods is increasingly considered in regulatory frameworks. The greenness of the HPTLC method was evaluated using five greenness assessment tools, including greenness, whiteness, and blueness metrics, confirming its eco-friendly nature [13]. This aligns with broader regulatory trends toward sustainable analytical practices.
Experimental Protocols for HPTLC Fingerprinting of Antimicrobial Compounds
Standardized HPTLC Protocol for Reproducible Fingerprinting
The standardized procedure for HPTLC fingerprinting of antimicrobial compounds involves multiple critical steps to ensure regulatory compliance and reproducibility [23]. The process begins with sample preparation using authenticated plant material extracted with appropriate solvents (e.g., 70% ethanol for phenolic antimicrobial compounds) [2]. The extraction method should be validated for optimal recovery of target antimicrobial compounds.
Plate application utilizes pre-coated HPTLC plates (silica gel 60 F254) with automated applicators (e.g., Camag Linomat) for precise sample band application [13] [24]. The application volume should be optimized to ensure detection within the linear range of the target antimicrobial compounds. Chromatographic development occurs in twin-trough chambers pre-saturated with the mobile phase for 15-20 minutes [13]. The mobile phase must be optimized for specific separation of antimicrobial compounds; for phenolic antimicrobial compounds, chloroform:ethyl acetate:formic acid:methanol (2.5:2:0.4:0.2, v/v/v/v) has demonstrated efficacy [2].
Detection and Documentation Protocol
Detection employs multiple modes including UV at 254 nm and 366 nm, visible light, and specific derivatization reagents tailored to antimicrobial compound classes [24] [2]. For densitometric quantification, the wavelength must be optimized for target compounds (e.g., 230 nm for certain antimicrobial pharmaceuticals) [13]. Documentation includes capturing images under different illumination conditions and generating densitometric scans for quantitative analysis [24].
The data analysis phase involves calculating Rf values, comparing with reference standards, and applying chemometric methods for pattern recognition [24]. For antimicrobial compounds, this may include correlating fingerprint patterns with antimicrobial activity through multivariate analysis.
The Scientist's Toolkit: Essential Research Reagents and Materials
Table 3: Essential Research Reagents for HPTLC of Antimicrobial Compounds
| Item | Function | Specification Example |
|---|---|---|
| HPTLC Plates | Stationary phase for separation | Silica gel 60 F254, 20×10 cm or 20×20 cm, 0.25 mm thickness [24] |
| Reference Standards | Compound identification and quantification | Certified reference materials for target antimicrobial compounds [24] |
| Mobile Phase Components | Chromatographic separation | HPLC-grade solvents; optimized for antimicrobial compounds [13] |
| Derivatization Reagents | Visualizing specific compound classes | Anisaldehyde sulfuric acid, NP/PEG for phenolics [24] |
| Internal Standards | Quantification accuracy | Esomeprazole for wavelength fluctuation compensation [13] |
| Extraction Solvents | Compound extraction from plant material | Ethanol, methanol, water in varying proportions [2] |
The selection of appropriate research reagents is critical for generating regulatory-compliant HPTLC data for antimicrobial compounds. HPTLC plates pre-coated with silica gel 60 F254 are the most widely used stationary phase, with 0.25 mm thickness providing optimal separation [24]. The plate size should be selected based on the number of samples to be analyzed, with 20×10 cm suitable for smaller batches and 20×20 cm for comprehensive studies.
Reference standards must be of pharmacopeial quality when available, with documented purity and sourcing [24]. For antimicrobial compounds not available as certified standards, purified isolates characterized by orthogonal methods may be used. Mobile phase components require HPLC-grade purity to minimize interference, with specific combinations optimized for different classes of antimicrobial compounds [13] [2].
The regulatory framework for herbal medicine quality control established by WHO and pharmacopeial standards provides a robust foundation for research on antimicrobial compounds using HPTLC fingerprinting. The integration of validated HPTLC methodologies within this regulatory context ensures that research outcomes are scientifically valid, reproducible, and translatable to product development.
For researchers focusing on bioactive antimicrobial compounds, adherence to these standards is essential for generating clinically relevant data. The continuing harmonization of global standards and the development of eco-friendly analytical methods represent significant advances in the field. By employing the protocols and methodologies outlined in this document, researchers can contribute to the development of safe, efficacious, and quality-controlled herbal medicines with validated antimicrobial activity.
Sample Preparation Techniques for Optimal Antimicrobial Compound Extraction
The pursuit of novel antimicrobial agents is a critical scientific endeavor in an era of rising antimicrobial resistance. The initial and most crucial step in this process is the efficient extraction of bioactive compounds from biological sources, which directly influences the success of subsequent isolation, identification, and standardization procedures. This document provides detailed application notes and protocols for sample preparation, framed within a research paradigm that utilizes High-Performance Thin-Layer Chromatography (HPTLC) fingerprinting for the standardization of bioactive antimicrobial compounds. Proper sample preparation is the foundation upon which reliable, reproducible, and analytically valid HPTLC results are built, ensuring that the resulting chemical and bioactivity profiles are accurate representations of the source material.
Core Extraction Principles and Method Selection
The primary goal of sample preparation is to efficiently isolate target antimicrobial compounds from a complex biological matrix while preserving their chemical integrity and bioactivity. The selection of an extraction method and solvent is guided by the chemical nature of the target compounds and the properties of the source material.
Solvent Selection Strategy
The choice of solvent is paramount and depends on the polarity of the anticipated bioactive compounds [26]. The following table summarizes common solvents and their applications.
Table 1: Common Solvents for Antimicrobial Compound Extraction
| Solvent | Polarity | Target Compound Classes | Considerations |
|---|---|---|---|
| n-Hexane | Non-polar | Lipophilic compounds, Chlorophyll removal | Often used for initial defatting or cleaning steps [26]. |
| Dichloromethane (DCM) | Moderate to low | Medium and low-polarity compounds | Effective for extracting a broad spectrum of antimicrobials; used in honey analysis [27]. |
| Ethyl Acetate | Intermediate | Flavonoids, Phenolic acids | Good balance of polarity and volatility; suitable for various secondary metabolites [28]. |
| Methanol/Ethanol | Polar | Flavonoids, Alkaloids, Polar phenolic acids | High extraction efficiency for a wide range of bioactive compounds; ethanol is safer [26] [29]. |
| Water | High | Polysaccharides, Polar glycosides, Proteins | Used in maceration or as a mixture with alcohol (e.g., methanol:water 8:2) [29]. |
Comparison of Extraction Techniques
Various techniques can be employed, each with distinct advantages and operational parameters. The choice often involves a trade-off between time, efficiency, and thermal sensitivity.
Table 2: Comparison of Common Extraction Techniques
| Extraction Method | Common Solvents | Temperature | Time Required | Key Advantages |
|---|---|---|---|---|
| Maceration | Methanol, Ethanol, Water | Room Temperature | 3–4 days | Simple, no specialized equipment needed [26]. |
| Soxhlet Extraction | Methanol, Ethanol, Hexane | Dependent on solvent boiling point | 3–18 hours | Exhaustive extraction, high efficiency [26]. |
| Sonification | Methanol, Ethanol | Can be heated | ~1 hour | Rapid, good efficiency for small samples [26]. |
| Solid-Phase Extraction (SPE) | Variable (used for cleanup) | Room Temperature | Varies | Purification and concentration of extracts [30]. |
The following workflow diagram illustrates the decision-making process for selecting and executing a sample preparation protocol leading to HPTLC analysis:
Detailed Experimental Protocols
Protocol 1: Extraction of Antimicrobial Compounds from Plant Material
This protocol is adapted from methods used for plants like Croton gratissimus and South African Combretaceae species [29] [31].
Objective: To extract medium- to high-polarity antimicrobial compounds (e.g., flavonoids, phenolic acids) from dried plant leaves for HPTLC fingerprinting and bioautography.
Materials & Reagents:
- Plant Material: Dried, powdered leaves (e.g., 10 g).
- Extraction Solvent: Methanol:Water mixture (8:2, v/v) [29].
- Equipment: Ultrasonic bath, filtration setup (Whatman No. 1 filter paper), rotary evaporator, glass vials.
Procedure:
- Weighing: Precisely weigh 1.0 g of the dried, homogenized plant powder into a sealed glass vial.
- Solvent Addition: Add 10 mL of the methanol:water (8:2, v/v) extraction solvent.
- Sonication: Place the vial in an ultrasonic bath and sonicate for 30 minutes at room temperature.
- Filtration: After sonication, filter the extract using filter paper into a round-bottom flask.
- Re-extraction: To ensure exhaustive extraction, repeat steps 2-4 on the residual plant material.
- Combination and Concentration: Combine the filtrates and concentrate to dryness under reduced pressure using a rotary evaporator (water bath temperature not exceeding 40°C).
- Reconstitution: Reconstitute the dried extract in 1 mL of dichloromethane or methanol to achieve a concentrated stock solution for HPTLC analysis.
- Storage: Store the final extract at 4°C until analysis.
Protocol 2: Extraction of Antimicrobial Metabolites from Microbial Broth
This protocol is based on procedures for isolating compounds from Streptomyces species [28].
Objective: To extract antimicrobial metabolites from the culture broth of fermenting bacteria or fungi.
Materials & Reagents:
- Source: Fermentation broth (e.g., of Streptomyces sp.), cell-free supernatant obtained by centrifugation.
- Extraction Solvent: Diethyl ether (Et₂O) or Ethyl Acetate (EtOAc) [28].
- Equipment: Separatory funnel, anhydrous MgSO₄ or Na₂SO₄, rotary evaporator.
Procedure:
- Separation: Centrifuge the fermentation broth to remove microbial cells. Use the cell-free supernatant.
- Liquid-Liquid Extraction: Transfer the supernatant to a separatory funnel. Add an equal volume of diethyl ether. Shake gently with periodic venting. Allow the phases to separate completely.
- Collection: Collect the organic (upper) layer.
- Re-extraction: Repeat the liquid-liquid extraction process twice more with fresh solvent.
- Drying: Combine all the organic extracts in a clean flask and add anhydrous magnesium sulfate (MgSO₄) to remove residual water. Swirl and let stand for 15 minutes.
- Filtration: Filter the dried extract through filter paper into a round-bottom flask.
- Concentration: Evaporate the solvent to dryness under reduced pressure using a rotary evaporator.
- Reconstitution and Storage: Reconstitute the residue in a small volume of methanol or DCM for HPTLC analysis and store at 4°C.
Protocol 3: HPTLC Analysis and Bioautography for Antimicrobial Activity
This protocol integrates chemical profiling with bioactivity screening, a powerful hyphenated technique [27] [31].
Objective: To separate the components of a crude extract and localize those with antimicrobial activity directly on the HPTLC plate.
Materials & Reagents:
- HPTLC Plates: Silica gel 60 F₂ₓ₄ (e.g., 20 x 10 cm).
- Sample Applicator: Semi-automated device (e.g., Linomat 5, CAMAG).
- Mobile Phase: System must be optimized. Example: Toluene:Ethyl Acetate:Formic Acid (6:5:1, v/v/v) for honey phenolics [27] or Ethyl Acetate:Acetic Acid:Formic Acid:Water (100:11:11:27, v/v/v/v) for plant extracts [29].
- Derivatization Reagents: Natural Product reagent (NP) or DPPH* for antioxidant activity [27] [29].
- Microbiological Materials: Mueller-Hinton Agar, test organism (e.g., Staphylococcus aureus, Bacillus subtilis), incubation equipment.
Procedure: Part A: HPTLC Fingerprinting
- Application: Using a semi-automated applicator, apply the reconstituted extracts and standards as 8 mm bands, 8 mm from the lower edge of the HPTLC plate.
- Chromatogram Development: Develop the plate in a pre-saturated twin-trough chamber with the optimized mobile phase until the solvent front has migrated approximately 80 mm from the origin.
- Drying: Air-dry the developed plate completely in a fume hood to remove all residual solvent.
- Documentation: Capture the chromatographic image under UV light (254 nm and 366 nm) and white light before and after derivatization.
Part B: Bioautography (Agar Overlay Assay)
- Preparation of Bioassay Plate: Prepare a thin layer of nutrient agar (e.g., Mueller-Hinton) seeded with a standardized suspension of the test microorganism (e.g., Bacillus subtilis) in a separate Petri dish.
- Transfer: Carefully overlay the developed and dried HPTLC plate onto the surface of the seeded agar. Ensure full contact and avoid air bubbles. Let it stand for 15-30 minutes to allow the diffusion of compounds from the plate into the agar.
- Incubation: Remove the HPTLC plate and incub the bioassay agar plate under appropriate conditions (e.g., 37°C for 24 hours) for the microorganism.
- Visualization: After incubation, clear zones of inhibition in the bacterial lawn will correspond to the location of antimicrobial compounds on the original HPTLC plate. The Rf values of these active bands can be recorded.
- Hyphenation with MS: For identification, the silica from the active bands (located via a parallel, non-overlaid plate) can be scraped off, eluted with a strong solvent, and subjected to mass spectrometric (MS) analysis [31].
The Scientist's Toolkit: Essential Research Reagents
The following table details key reagents and materials critical for the success of the extraction and HPTLC bioautography protocols described herein.
Table 3: Key Research Reagent Solutions for Extraction and HPTLC-Bioautography
| Reagent/Material | Function/Application | Notes |
|---|---|---|
| Methanol:Water (8:2, v/v) | A versatile solvent for extracting a broad range of medium- to high-polarity bioactive compounds from plant material [29]. | Adjust the ratio based on target compound polarity. |
| Diethyl Ether (Et₂O) | Used for liquid-liquid extraction of antimicrobial metabolites from aqueous fermentation broth [28]. | Highly volatile and flammable; requires careful handling in a fume hood. |
| Dichloromethane (DCM) | A medium-polarity solvent for re-extracting dried honey or for reconstituting dried extracts prior to HPTLC [27]. | Common solvent for lipophilic fractions. |
| HPTLC Silica Gel 60 F₂ₓ₄ Plates | The stationary phase for the high-resolution separation of complex extract mixtures [27] [30]. | Fluorescent indicator allows visualization under UV light. |
| DPPH* Derivatization Reagent | A spraying reagent used to visualize antioxidant compounds directly on the HPTLC plate as yellow bands on a purple background [27]. | Prepared as 0.04% (w/v) solution in 50% methanol/ethanol. |
| Vanillin / Anisaldehyde Reagents | General-purpose derivatization reagents that produce colored bands with various compound classes (terpenes, phenolics) upon heating [27] [30]. | Essential for creating comprehensive visual fingerprints. |
| Toluene:Ethyl Acetate:Formic Acid | A commonly used mobile phase system for the separation of phenolic compounds and flavonoids in natural product extracts [27]. | Ratios must be optimized for specific sample types. |
| Nutrient Agar & Test Strains | Required for bioautography to visualize antimicrobial activity. Common test strains include B. subtilis, S. aureus, and E. coli [28] [31]. | Strains are selected based on the research focus (e.g., MRSA for drug-resistant bacteria). |
Advanced HPTLC Method Development for Antimicrobial Profiling
Systematic Mobile Phase Optimization for Bioactive Compound Separation
High-performance thin-layer chromatography (HPTLC) is a sophisticated, robust, and cost-efficient analytical technique widely employed in pharmaceutical and natural product research for the separation, identification, and quantification of bioactive compounds [1]. Within the broader context of HPTLC fingerprinting for standardization of bioactive antimicrobial compounds, the critical factor governing the success of any HPTLC analysis is the selection and optimization of the mobile phase [32]. An optimally designed mobile phase ensures sufficient resolution of complex mixtures, enabling accurate bioautography and subsequent chemometric analysis for the detection of antimicrobial constituents [33] [34]. This protocol details a systematic strategy for mobile phase optimization to achieve reproducible separation of bioactive antimicrobial compounds from complex matrices, such as plant and marine organism extracts.
The Scientist's Toolkit: Essential Materials and Reagents
Table 1: Key Research Reagent Solutions for HPTLC Method Development
| Reagent/Material | Function/Application | Exemplary Use in Antimicrobial Research |
|---|---|---|
| HPTLC Silica gel 60 F₂₅₄ Plates | Stationary phase for chromatographic separation; F₂₅₄ indicates fluorescent indicator. | Standard support for separating complex extracts; used in analysis of Nymphaea nouchali seed antimicrobials [33]. |
| Solvents (e.g., Toluene, Ethyl Acetate, Chloroform, Methanol) | Components of the mobile phase; varying polarities to achieve desired separation. | Toluene:Ethyl Acetate:Acetic acid (60:37.5:2.5, V/V/V) effectively separated antioxidants and antimicrobials in marine sponge extracts [34]. |
| Derivatization Reagents (e.g., Sulfuric Vanillin, p-Anisaldehyde) | Chemical spraying agents to visualize non-UV active compounds by producing colored zones. | Used for post-chromatographic derivatization to detect various secondary metabolites after separation [32]. |
| Bioautography Reagents (e.g., DPPH, Microbial Suspensions) | Effect-directed analysis (EDA) reagents to locate bioactive zones directly on the plate. | DPPH for antioxidant activity; agar overlay with pathogenic bacteria (e.g., S. aureus, P. aeruginosa) for antimicrobial activity [33] [34]. |
| Standard Reference Compounds | Authentic compounds for co-chromatography to confirm identity and for calibration in quantification. | Essential for method validation and for identifying bioactive zones in complex mixtures via Rf value and spectrum comparison [32]. |
Systematic Mobile Phase Optimization Strategy
Mobile phase optimization is an iterative process that moves from general screening to fine-tuning, with the goal of achieving a robust system capable of resolving the compounds of interest from each other and from matrix interferences.
Initial Screening and Scouting
Begin by testing standard solvent systems of varying polarity and selectivity. A useful approach is to use PRISMA, a three-step optimization model involving (1) selection of solvents from different selectivity groups, (2) optimization of the solvent ratio, and (3) fine-tuning with modifiers [35].
- Solvent Selectivity Groups: Choose solvents from different selectivity groups (e.g., chloroform from Group I, ether from Group V, and acetic acid from Group I) to maximize the chance of achieving different selectivity patterns.
- Initial Binary and Ternary Mixtures: Start with simple mixtures (e.g., Hexane-Ethyl Acetate, Chloroform-Methanol, Toluene-Ethyl Acetate) and observe the migration of analytes and matrix components.
- Example from Literature: For the simultaneous determination of ivabradine and metoprolol, an optimized mobile phase of chloroform: methanol: formic acid: ammonia (8.5:1.5:0.2:0.1, v/v) provided excellent resolution [35]. This illustrates the use of a base solvent (chloroform), a polar modifier (methanol), and acidic and basic modifiers to control ionization and peak shape.
Fine-Tuning for Complex Bioactive Mixtures
The initial screening provides a starting point, but fine-tuning is often necessary for complex natural extracts containing antimicrobials.
- pH Modifiers (Acids/Bases): The addition of small amounts of formic acid, acetic acid, or ammonia can suppress the ionization of acidic or basic compounds, reducing tailing and improving spot shape. The analysis of phenolic compounds in Nymphaea nouchali seeds utilized acidic mobile phases for optimal separation [33].
- Solvent Strength and Selectivity Adjustment: Systematically adjust the volume ratios of the selected solvents. Even a 1-5% change can significantly impact resolution (Rf). The goal is to achieve Rf values for key analytes ideally between 0.2 and 0.8, with a difference of at least 0.05 between critical pairs.
- Resolution of Bioactive Zones: The ultimate test is the ability to resolve zones that show activity in bioautography. For instance, the separation of antibacterial and antioxidant compounds from marine sponges was achieved with Toluene: Ethyl acetate: Acetic acid (60:37.5:2.5, V/V/V), where acetic acid was critical for resolving the target bioactives [34].
Optimization and Validation Workflow
The following diagram illustrates the logical workflow for the systematic optimization of the HPTLC mobile phase.
Experimental Protocol: A Practical Guide
Materials and Instrumentation
- HPTLC Plates: HPTLC silica gel 60 F₂₅₄ (e.g., 10 cm x 10 cm or 20 cm x 10 cm).
- Application Device: Automated sample applicator (e.g., CAMAG Linomat 5).
- Development Chamber: Twin-trough glass chamber for saturated development.
- Densitometer: TLC Scanner (e.g., CAMAG TLC Scanner 3) controlled by winCATS or similar software.
- Documentation: TLC Visualizer or digital camera under UV light (254 nm, 366 nm) and white light after derivatization.
Step-by-Step Optimization Procedure
Sample Preparation:
- Dissolve the crude extract or standard compounds in a suitable solvent (e.g., methanol) at a typical concentration of 1-10 mg/mL.
- Centrifuge or filter (0.45 µm) to remove particulate matter.
Sample Application:
- Apply the sample as bands (e.g., 4-6 mm wide) onto the HPTLC plate using an automated applicator. A typical application volume is 1-10 µL.
- Maintain a consistent distance from the bottom (e.g., 8 mm) and edge (e.g., 10 mm) of the plate.
Chromatogram Development:
- Condition the twin-trough chamber with the mobile phase for 20-30 minutes at room temperature to achieve saturation.
- Develop the plate to a distance of 70-80 mm from the application point.
- Dry the plate completely in a fume hood after development.
Derivatization and Detection:
- Examine the plate under UV light at 254 nm and 366 nm.
- Derivatize with appropriate reagents (e.g., DPPH for antioxidants, sulfuric vanillin for general compounds, etc.).
- For antimicrobial detection, use bioautography by overlaying the plate with agar inoculated with a test microorganism (e.g., S. aureus, E. coli) [33].
Densitometric Evaluation and Data Analysis:
- Scan the plate at the appropriate wavelength in absorbance or fluorescence mode.
- Record the retention factor (Rf) and peak areas for all relevant bands.
- Use chemometric tools or software to compare chromatographic profiles.
Table 2: Key Mobile Phase Formulations for Bioactive Compound Separation from Literature
| Analyte / Extract | Optimized Mobile Phase Composition (v/v/v) | Key Separation Outcome | Source |
|---|---|---|---|
| Ivabradine & Metoprolol | Chloroform : Methanol : Formic Acid : Ammonia (8.5 : 1.5 : 0.2 : 0.1) | Successful resolution of two cardiovascular drugs in a single run. | [35] |
| Marine Sponge Bioactives (e.g., Avarol) | Toluene : Ethyl Acetate : Acetic Acid (60 : 37.5 : 2.5) | Effective separation of single antimicrobial and antioxidant compounds for direct bioautography. | [34] |
| Phenolics in N. nouchali Seeds | Chloroform : Ethyl Acetate : Formic Acid : Methanol (2.5 : 2 : 0.4 : 0.2) | Quantification of catechin, gallic acid, and quercetin linked to antimicrobial activity. | [33] |
Integration with Chemometrics and Bioautography
The final optimized HPTLC method is not an endpoint but a starting point for advanced analysis within a standardization workflow.
- Chemometric Analysis: The densitometric data (peak areas and Rf values) from the optimized separation can be subjected to multivariate statistical analysis, such as the sparse Heterocovariance Approach (sHetCA), to correlate chemical profiles with biological activity across multiple fractions [32]. This helps pinpoint which resolved compounds are responsible for the observed antimicrobial effect.
- Hyphenation with Spectroscopic Techniques: Bioactive zones resolved with the optimized mobile phase can be scraped off, eluted, and directly characterized using techniques like FTIR, NMR, or HRMS for structural elucidation [34]. This creates a powerful pipeline from separation to identification.
The following workflow integrates mobile phase optimization into a comprehensive HPTLC-based strategy for discovering bioactive antimicrobial compounds.
Concluding Remarks
A systematic approach to mobile phase optimization is foundational to developing robust HPTLC methods for the standardization of bioactive antimicrobial compounds. By moving from initial solvent screening to fine-tuning with modifiers and validating separation efficiency through bioautography, researchers can establish reliable HPTLC fingerprints. These fingerprints, when integrated with chemometrics and modern spectroscopic techniques, form a comprehensive strategy for the discovery, authentication, and quality control of complex natural products, directly supporting the objectives of a thesis in this field. The protocols and data presentation formats detailed here provide a clear roadmap for researchers and drug development professionals.
In High-Performance Thin-Layer Chromatography (HPTLC), the stationary phase (sorbent) is a critical determinant for achieving high-resolution separations essential for standardizing bioactive antimicrobial compounds [1]. The selection of an appropriate sorbent directly influences the efficiency, reproducibility, and overall success of the analytical method, impacting parameters such as resolution, analysis time, and detection sensitivity [36] [37]. Modern HPTLC utilizes a diverse range of sophisticated stationary phases that extend far beyond conventional silica gel, each offering unique selectivity profiles for different classes of antimicrobial compounds [36] [38]. These sorbents are typically coated on glass or aluminum backing in layers approximately 0.25 mm thick, with particle sizes optimized to 5-7 µm for superior performance compared to traditional TLC [36] [37]. This article provides a comprehensive guide to stationary phase selection, supported by structured protocols for antimicrobial compound research.
Silica Gel-Based Sorbents
Classical Silica Gel HPTLC Plates represent the most widely used normal-phase stationary phase, comprising porous silica gel 60 with a particle size of 5-6 µm and often containing fluorescent indicators (F254 or F254s) for UV visualization [36]. The separation mechanism relies on adsorption chromatography, where analytes interact with surface silanol groups through hydrogen bonding and dipole-dipole interactions [36] [38]. These plates are particularly suitable for separating moderately polar to non-polar antimicrobial compounds, including many natural product extracts and pharmaceutical formulations [36] [1].
Premium Purity Silica Gel Plates are specially manufactured to prevent contamination from plasticizers, which is crucial when analyzing antimicrobial compounds where unknown additional zones could interfere with results [36]. These plates are packaged in plastic-coated aluminum foil and are recommended for pharmacopeia applications and sensitive analyses requiring the highest level of purity [36].
LiChrospher HPTLC Plates incorporate spherical silica particles with a narrow size distribution (7 µm), providing enhanced separation efficiency and reduced analysis times compared to conventional HPTLC plates [36]. The spherical geometry creates a more homogeneous layer with improved flow characteristics, leading to highly compact spots or zones that significantly improve detection sensitivity for trace antimicrobial compounds in complex matrices [36].
Chemically Modified Sorbents
Reversed-Phase Sorbents include RP-2, RP-8, and RP-18 modifications, where silica gel is derivatized with dimethyl- (RP-2), octyl- (RP-8), or octadecyl- (RP-18) silane groups [36]. These sorbents operate on a partition chromatography mechanism, where separation depends on the differential partitioning of analytes between the polar mobile phase and the hydrophobic stationary phase [36]. The RP-18W variant features a lower degree of surface modification, allowing operation with 100% aqueous mobile phases, which is particularly beneficial for polar antimicrobial compounds [36].
Polar Modified Sorbents include CN (cyano), DIOL, and NH2 (amino) functionalities, offering intermediate polarity and versatile applications [36]. CN-modified plates (cyanopropyl groups) can operate in both normal-phase and reversed-phase modes, enabling unique two-dimensional separations [36]. DIOL plates (vicinal diol alkyl ether) provide moderately polar characteristics with hydrogen-bonding capacity, while NH2-modified plates exhibit weakly basic ion-exchange properties with exceptional selectivity for charged molecules such as nucleotides and sulfonic acids [36].
Cellulose-Based Sorbents consist of microcrystalline cellulose arranged in a rod-shaped structure and are specifically designed for separating hydrophilic compounds through partition chromatography [36]. These plates are particularly valuable for analyzing antimicrobial compounds such as nucleic acids, phosphates, carbohydrates, and amino acids, and are notably beneficial for two-dimensional separations in metabolic studies [36].
Table 1: Comparative Characteristics of HPTLC Stationary Phases for Antimicrobial Compound Analysis
| Stationary Phase Type | Particle Size (µm) | Separation Mechanism | Optimal Application for Antimicrobial Compounds | Tolerance to Aqueous Solvents |
|---|---|---|---|---|
| Silica Gel 60 | 5-6 | Adsorption | Medium to non-polar antimicrobials; herbal extracts | Low |
| LiChrospher Silica | 7 (spherical) | Adsorption | High-throughput analysis of complex antimicrobial mixtures | Low |
| RP-2 | 5-6 | Partition | Polar to medium-polarity antimicrobials | Up to 80% water |
| RP-8 | 5-6 | Partition | Medium to non-polar antimicrobials | Up to 60% water |
| RP-18 | 5-6 | Partition | Non-polar antimicrobials; lipophilic compounds | Up to 60% water |
| RP-18W | 5-6 | Partition | Highly polar, water-soluble antimicrobials | 100% water |
| CN-Modified | 5-6 | Mixed-mode | Versatile for both polar and non-polar antimicrobials | Moderate |
| DIOL-Modified | 5-6 | Hydrogen bonding | Compounds with hydrogen-bonding functionality | Moderate |
| NH2-Modified | 5-6 | Ion-exchange | Charged antimicrobials; nucleotides, sulfonic acids | High |
| Cellulose | Microcrystalline | Partition | Hydrophilic antimicrobials; carbohydrates, amino acids | High |
Table 2: Performance Characteristics of Different HPTLC Sorbents
| Stationary Phase | Separation Efficiency | Development Time | Detection Sensitivity | Reproducibility | Humidity Dependence |
|---|---|---|---|---|---|
| Classical Silica | High | 7-20 minutes | 5-10x better than TLC | High | High |
| LiChrospher | Very High | 20% faster than HPTLC | Enhanced | Very High | High |
| Reversed-Phase | High | 10-25 minutes | High | High | Low |
| Polar Modified | Medium-High | 10-20 minutes | High | High | Low-Medium |
| Cellulose | Medium | 15-30 minutes | Medium | Medium | Low |
Selection Criteria for Antimicrobial Compound Analysis
Chemical Properties of Target Analytics
The chemical characteristics of antimicrobial compounds fundamentally guide stationary phase selection. Key considerations include polarity (hydrophilic compounds separate well on cellulose or NH2-modified phases, while lipophilic compounds are ideal for reversed-phase sorbents), ionization state (ionizable compounds benefit from NH2-modified phases with ion-exchange capabilities or reversed-phase with pH-controlled mobile phases), functional groups (hydrogen-bonding compounds interact well with DIOL phases, while aromatic systems separate effectively on silica gel), and molecular size (larger molecules require sorbents with appropriate pore sizes) [36] [34].
For complex antimicrobial extracts containing compounds with diverse polarities, such as marine sponge metabolites (including alkaloids and terpenoids), CN-modified plates offer unique advantages as they accommodate both normal-phase and reversed-phase mechanisms, enabling comprehensive profiling in a single analysis [36] [34].
Mobile Phase Compatibility
Stationary phase selection must consider mobile phase requirements. Normal-phase silica gel operates with organic solvents (hexane, ethyl acetate, chloroform, methanol mixtures), while reversed-phase sorbents require aqueous-organic mixtures [36] [37]. The RP-18W sorbent is particularly valuable for highly polar, water-soluble antimicrobials as it tolerates 100% aqueous mobile phases without destabilization [36].
Detection Requirements
Detection methodology significantly influences sorbent selection. For UV detection at 254 nm, sorbents with acid-stable fluorescent indicators (F254s) provide optimal sensitivity through fluorescence quenching [36]. For post-chromatographic derivatization with specific detection reagents (e.g., anisaldehyde for terpenoids), premium purity plates prevent interference from sorbent impurities [36]. Bioautography detection requires sorbents with minimal background bioactivity; silica gel and cellulose typically perform well in antimicrobial bioassays [34].
Sample Complexity
For highly complex antimicrobial mixtures, AMD HPTLC plates with extra-thin layers (100 µm) provide superior resolution through automated multiple development with gradient elution, capable of resolving up to 40 components over just 60 mm [36]. Two-dimensional separation on CN-modified plates (normal phase in first direction, reversed phase in second direction) offers exceptional resolution for comprehensive antimicrobial metabolite profiling [36].
Experimental Protocols
Protocol 1: HPTLC Method Development for Antimicrobial Compounds
Objective: To develop and optimize an HPTLC method for screening antimicrobial compounds from natural sources using bioautography detection.
Materials and Reagents:
- HPTLC plates (Silica Gel 60 F254, 10x10 cm or 10x20 cm)
- Mobile phase components (HPLC grade): ethyl acetate, methanol, toluene, glacial acetic acid, hexane, chloroform
- Sample solutions: antimicrobial extracts dissolved in appropriate solvents (methanol, ethanol, or ethyl acetate)
- Derivatization reagents: anisaldehyde-sulfuric acid, vanillin-sulfuric acid, ninhydrin
- Bioautography materials: bacterial suspensions (e.g., Staphylococcus aureus, Escherichia coli), culture media, tetrazolium dyes (MTT) for viability staining
Procedure:
- Stationary Phase Selection: Begin method development with silica gel 60 F254 plates as the default sorbent for antimicrobial screening [37].
- Initial Mobile Phase Screening: Test the following mobile phase systems in a twin-trough chamber with 10-15 mL mobile phase volume:
- Ethyl acetate: methanol: water (80:10:10, v/v/v)
- Toluene: ethyl acetate: glacial acetic acid (60:37.5:2.5, v/v/v) [34]
- Chloroform: methanol (90:10, v/v)
- Ethyl acetate: hexane (40:60, v/v)
- Plate Development: Pre-saturate the chamber for 15-20 minutes at room temperature. Develop the plate to a distance of 70 mm from the origin. Dry plates completely in a fume hood or with a stream of cool air.
- Visualization and Documentation: Examine plates under UV light at 254 nm and 366 nm. Document images before and after derivatization.
- Method Optimization: Adjust mobile phase composition based on initial results. For poor separation, increase solvent strength by adding more polar solvents; for excessive migration, decrease solvent strength. For unsatisfactory selectivity, introduce solvents from different selectivity groups.
- Bioautography Detection: For antimicrobial activity screening, transfer developed and dried plates to bioautography by carefully overlaying with agar inoculated with test microorganisms. Incubate at appropriate conditions (e.g., 37°C for 2-24 hours), then visualize inhibition zones with tetrazolium dyes [34].
Protocol 2: Two-Dimensional Separation of Complex Antimicrobial Extracts
Objective: To achieve comprehensive separation of complex antimicrobial extracts using two-dimensional HPTLC on CN-modified plates.
Materials and Reagents:
- CN-modified HPTLC plates (10x10 cm)
- Normal phase mobile phase: hexane: ethyl acetate (70:30, v/v)
- Reversed-phase mobile phase: methanol: water (80:20, v/v)
- Antimicrobial extract solution (10 mg/mL in methanol)
Procedure:
- Sample Application: Apply sample as a single spot (1-2 µL) 10 mm from both the bottom and left edges of the CN-modified plate.
- First Development: Develop the plate in the normal-phase direction using hexane: ethyl acetate (70:30, v/v) in a twin-trough chamber saturated for 15 minutes.
- Intermediate Drying: Remove the plate and dry thoroughly under a stream of cool air for 5 minutes.
- Second Development: Rotate the plate 90° counterclockwise and develop in the reversed-phase direction using methanol: water (80:20, v/v) in a freshly prepared chamber.
- Final Drying and Detection: Dry the plate completely and detect compounds under UV light at 254 nm and 366 nm, followed by appropriate derivatization reagents.
- Bioactivity Correlation: Excise individual zones for further MS analysis or correlate zone positions with bioautography results to identify active antimicrobial compounds [34].
HPTLC-Bioautography Workflow for Antimicrobial Compound Discovery
The following diagram illustrates the integrated workflow for screening antimicrobial compounds using HPTLC coupled with bioautography and MS identification:
HPTLC-Bioautography Workflow for Antimicrobial Discovery
The Scientist's Toolkit: Essential Research Reagents and Materials
Table 3: Essential Research Reagents and Materials for HPTLC Analysis of Antimicrobial Compounds
| Item | Specification | Function/Application | Example Sources/References |
|---|---|---|---|
| HPTLC Plates | Silica Gel 60 F254, 10x10 cm or 10x20 cm | Standard stationary phase for initial method development | Merck, Sigma-Aldrich [36] |
| CN-Modified Plates | Cyanopropyl-modified silica gel | Two-dimensional separations; mixed-mode chromatography | Merck [36] |
| RP-18W Plates | C18-modified silica with high water tolerance | Reversed-phase separation of polar antimicrobials | Merck [36] |
| Sample Applicator | Automated Linomat IV/V | Precise sample application as bands | Camag [13] [39] |
| Development Chamber | Twin-trough chamber (10x10 cm or 20x10 cm) | Controlled mobile phase development | Camag [37] |
| Mobile Phase Components | HPLC grade solvents: methanol, ethyl acetate, toluene, etc. | Mobile phase preparation for optimal separation | Various suppliers [13] [34] |
| Derivatization Reagents | Anisaldehyde-sulfuric acid, vanillin-sulfuric acid | Visualization of antimicrobial compounds | Sigma-Aldrich [36] [34] |
| Bioautography Materials | Microbial strains, agar, tetrazolium dyes (MTT) | Detection of antimicrobial activity | ATCC, Sigma-Aldrich [34] |
| HPTLC Scanner | Densitometer with UV/Vis capability | Quantitative analysis of separated compounds | Camag TLC Scanner [13] [39] |
| HPTLC-MS Interface | Plate extraction interface for mass spectrometry | Structural identification of active compounds | Various suppliers [34] [11] |
Advanced Applications in Antimicrobial Research
Marine Sponge Antimicrobial Compound Profiling
Research on marine sponges has successfully employed HPTLC with silica gel stationary phases to identify potent antimicrobial compounds such as avarol, a sesquiterpenoid hydroquinone from Dysidea avara [34]. The optimal separation was achieved using a mobile phase of toluene: ethyl acetate: acetic acid (60:37.5:2.5, V/V/V) with detection under white light, UV 254 nm, and 366 nm, followed by bioautography against pathogenic bacterial strains including Staphylococcus aureus and Escherichia coli [34].
Microbial Metabolite Screening
HPTLC on silica gel 60 F254 has been utilized to screen antimicrobial compounds from bacterial sources, such as Brevibacillus brevis EGS9, showing activity against multi-drug resistant Staphylococcus aureus (MDRSA) [40]. The ethyl acetate extracts were separated, and HPTLC fingerprint profiles correlated with antimicrobial activity zones, facilitating the identification of active compounds for further pharmaceutical development [40].
Veterinary Drug Residue Analysis
A validated HPTLC method using silica gel 60 F254 plates was developed for simultaneous quantification of florfenicol (antibiotic) and meloxicam (anti-inflammatory) in bovine muscle tissue [13]. The method employed a mobile phase of glacial acetic acid: methanol: triethylamine: ethyl acetate (0.05:1.00:0.10:9.00, by volume) with densitometric detection at 230 nm, demonstrating the application of HPTLC for monitoring antimicrobial residues in food products to ensure safety and regulatory compliance [13].
Troubleshooting and Optimization Guidelines
Common Stationary Phase Issues and Solutions
- Poor Resolution: Switch to sorbents with smaller particle sizes (e.g., LiChrospher with 7 µm spherical particles) or try chemically modified phases for different selectivity [36].
- Tailing Spots: Use premium purity plates to avoid contaminant interactions or incorporate acid/base modifiers in the mobile phase [36].
- Inconsistent Migration: Pre-wash plates with methanol and reactivate by heating at 120°C for 20 minutes before use [37].
- Low Detection Sensitivity: Employ plates with narrower particle size distribution or spherical particles for more compact zones [36].
- Humidity Sensitivity: Use reversed-phase or polar modified sorbents that are less affected by atmospheric humidity [36].
Method Validation Parameters
For quantitative analysis of antimicrobial compounds, method validation should include:
- Specificity: Resolution from other compounds in the matrix [39]
- Linearity: Typically 0.03-3.00 µg/band for sensitive compounds like meloxicam [13]
- Detection Limits: As low as 2.42 ng/band for compounds like caffeine [39]
- Accuracy and Precision: Percent recovery of 96-104% with RSD <2.74% [39]
- Robustness: Testing small variations in mobile phase composition and chamber saturation [39]
Strategic selection of stationary phases is fundamental to successful HPTLC analysis of antimicrobial compounds for standardization and research. While silica gel remains the versatile default choice, modern chemically modified sorbents offer enhanced selectivity for specific applications, particularly when coupled with bioautography detection. The integration of HPTLC with advanced detection techniques including mass spectrometry provides a powerful platform for comprehensive antimicrobial compound analysis, from initial discovery through standardization and quality control.
High-performance thin-layer chromatography coupled with direct bioautography (HPTLC-DB) is an evolving analytical technology that integrates the superior separation power of HPTLC with targeted biological detection to directly localize antimicrobial compounds on the chromatographic plate [41]. This method provides a rapid, economical, and highly sensitive approach for the function-based screening of complex mixtures, making it particularly valuable for natural product research and drug discovery [41] [11].
Within the broader context of HPTLC fingerprinting for standardization of bioactive antimicrobial compounds, bioautography serves as a critical bridge between chemical profiling and biological activity assessment [11]. This technique allows researchers to directly correlate specific bands on an HPTLC plate with antimicrobial effects, enabling the rapid identification of lead compounds for further development while advancing the standardization of bioactive natural products through effect-directed profiling.
Fundamental Principles of HPTLC-Bioautography
HPTLC-bioautography combines planar chromatography with microbiological detection, allowing for the direct localization of antimicrobial activity on the chromatographic plate [41]. The process involves first separating complex mixtures using HPTLC, then applying a biological system (e.g., bacterial suspensions) directly to the plate, and finally detecting zones of inhibition where antimicrobial compounds have prevented microbial growth [41] [42]. This method offers significant advantages over conventional bioassay-guided fractionation, as it eliminates the need for extensive compound purification before activity assessment, thereby accelerating the screening process.
The technique has evolved significantly since its initial development for antimicrobial screening in 1961 [41]. Modern HPTLC-bioautography provides high sensitivity and specificity, with the capacity to detect compounds present in nanogram quantities [41] [42]. Recent advancements have further enhanced its utility through integration with mass spectrometry and other detection modalities, creating versatile "HPTLC+" platforms that support comprehensive compound identification and characterization [11].
Modes of Bioautography
Three principal modes of TLC bioautography have been developed, each with distinct methodological approaches and applications:
Agar Diffusion (Contact) Method: This classical approach involves placing the developed TLC plate face-down on an agar medium inoculated with test microorganisms [41]. After a diffusion period, the plate is removed and the agar is incubated. Antimicrobial compounds diffuse from the plate into the agar, creating inhibition zones in the microbial lawn. While simple in concept, this method has limitations including potential damage to the agar layer during plate removal and variable diffusion rates of different compounds [41].
Agar Overlay Method: This technique combines aspects of both diffusion and direct methods. Microorganisms are incorporated into a thin layer of soft agar which is then overlaid onto the developed TLC plate [41]. After incubation, clear zones appear where antimicrobial compounds have inhibited microbial growth. This approach often provides better contact between compounds and microorganisms compared to the simple agar diffusion method.
Direct Bioautography (DB): As the most frequently used and technically straightforward approach, DB involves directly spraying a microbial suspension or immersing the developed TLC plate into such a suspension [41] [42]. The plate is then incubated in a humid environment, allowing microorganisms to grow directly on the plate surface. Bioactive compounds appear as clear zones against a background of microbial growth, which can be visualized directly or with tetrazolium dyes that form colored formazan products in metabolically active cells [43] [42]. DB is particularly suitable for aerobic microorganisms and provides excellent resolution for localizing antimicrobial activity.
Experimental Protocols
Standard Operating Procedure for Direct Bioautography
Method Name: Direct Bioautography for Antimicrobial Compound Detection [43] [42] [44]
Principle: This protocol enables the direct localization of antimicrobial compounds on HPTLC plates through the application of a microbial suspension and subsequent visualization of growth inhibition zones.
Materials and Equipment:
- HPTLC plates (e.g., silica gel 60 F254, 20 × 20 cm)
- Automatic sample applicator (e.g., CAMAG Linomat)
- Chromatography chamber
- Microbial strains (e.g., Staphylococcus aureus, Escherichia coli, Candida albicans)
- Nutrient broth (e.g., Mueller-Hinton Broth)
- Incubator (37°C)
- Biological safety cabinet
- Detection reagent: p-Iodonitrotetrazolium chloride (INT) solution (0.2-2 mg/mL) [43] [42]
- Fixation solution: Sodium chloride (0.85% w/v) optionally with glutaraldehyde (0.2% v/v) [44]
Procedure:
Sample Application and Chromatographic Separation
- Apply test samples and standards as bands (e.g., 8 mm) to HPTLC plates using an automatic applicator.
- Develop plates in an appropriate mobile phase within a pre-saturated chromatography chamber.
- Dry plates completely at room temperature to remove residual solvent.
Microbial Suspension Preparation
- Inoculate microbial strains into appropriate liquid medium (e.g., Mueller-Hinton Broth for bacteria, Sabouraud Broth for fungi).
- Incubate with shaking at optimal temperature (typically 37°C for human pathogens) until reaching logarithmic growth phase (OD₆₀₀ ≈ 0.5-0.8 for bacteria).
- Adjust suspension concentration to approximately 10⁶ CFU/mL using sterile saline.
Bioautography Assay
- Option A (Spray Application): Evenly spray the microbial suspension onto the developed HPTLC plate using a sterile atomizer in a biological safety cabinet [42].
- Option B (Immersion Application): Carefully dip the developed HPTLC plate into the microbial suspension for a few seconds, then drain excess liquid [41] [44].
- Transfer the inoculated plate to a humid chamber and incubate at appropriate temperature (e.g., 37°C) for 2-24 hours based on microbial growth characteristics.
Visualization of Inhibition Zones
- Prepare INT solution (0.2-2 mg/mL in water or buffer) [43] [42].
- Spray INT solution evenly onto the incubated plate.
- Return plate to humid chamber and incubate for 30 minutes to 4 hours until purple-red formazan color develops in areas with microbial growth.
- Alternatively, for more robust cell fixation, particularly with Gram-negative bacteria like E. coli, immerse plates in 0.85% NaCl solution with 0.2% glutaraldehyde for 1-2 minutes before INT staining [44].
- Document results under visible light; inhibition zones appear as clear areas against a colored background.
Critical Notes:
- Maintain strict aseptic techniques throughout the procedure.
- Optimize microbial suspension concentration and incubation time for each strain.
- Include appropriate positive (known antimicrobials) and negative (solvent only) controls on each plate.
- For fragile microorganisms like E. coli, the fixation step before INT staining improves zone clarity [44].
Minimum Effective Dose (MED) Determination
Principle: This modified direct bioautography protocol enables semi-quantitative assessment of antimicrobial potency by determining the minimum amount of compound required to produce a detectable inhibition zone on the TLC plate [44].
Procedure:
- Apply serial dilutions of test compounds and standards to HPTLC plates.
- Perform chromatographic separation and bioautography as described above.
- After visualization, identify the lowest concentration producing a clear inhibition zone.
- Calculate MED as micrograms of compound per square centimeter of plate surface (μg/cm²).
- Example: Grandiflorone from Manuka exhibited MED values of 0.29-0.59 μg/cm² against S. aureus and 2.34-4.68 μg/cm² against E. coli [44].
Essential Research Reagents and Materials
Table 1: Key Research Reagent Solutions for HPTLC-Bioautography
| Reagent/Material | Function/Purpose | Examples/Specifications |
|---|---|---|
| HPTLC Plates | Stationary phase for compound separation | Silica gel 60 F254, 5 μm particle size, 0.25 mm thickness [13] |
| Microbial Strains | Bioactivity indicators | Staphylococcus aureus, Escherichia coli, Candida albicans, Bacillus subtilis [45] [43] [42] |
| Growth Media | Microbial culture and suspension preparation | Mueller-Hinton Broth (bacteria), Sabouraud Broth (fungi) [12] [42] |
| Tetrazolium Salts | Visualization of microbial viability | INT (p-Iodonitrotetrazolium chloride), MTT (Thiazolyl Blue Tetrazolium Bromide) [43] [42] |
| Mobile Phase | Compound separation | Solvent mixtures specific to analyte properties; e.g., ethyl acetate-methanol-glacial acetic acid-triethylamine [13] |
| Fixation Solution | Cell membrane stabilization | Sodium chloride (0.85% w/v) with glutaraldehyde (0.2% v/v) for Gram-negative bacteria [44] |
Representative Applications and Data
Antimicrobial Compound Screening in Natural Products
HPTLC-bioautography has been successfully applied to screen antimicrobial compounds from diverse natural sources:
Propolis Analysis: Screening of 53 Serbian propolis samples against Staphylococcus aureus and Listeria monocytogenes revealed strong antimicrobial activity, with one sample showing exceptional potency (MIC of 0.1 mg/mL against L. monocytogenes) [42]. Bioautography identified multiple active phenolic compounds at Rf values 0.37, 0.40, 0.45, 0.51, 0.60, and 0.70 responsible for the observed effects.
Medicinal Plant Screening: Analysis of Ligusticum chuanxiong essential oil against Candida albicans identified ligustilide and senkyunolide A as primary antifungal components using HPTLC-bioautography guided isolation [45]. The method demonstrated significant advantages in high-throughput screening of complex essential oil mixtures.
Manuka Leaf Extracts: Direct bioautography against S. aureus enabled rapid targeted isolation of antibacterial β-triketones (leptospermone, flavesone, grandiflorone) and flavonoids from Manuka leaf and branch extracts [44]. The technique facilitated comparison of antibacterial profiles between New Zealand and Chinese Manuka samples.
Quantitative Antimicrobial Data from Bioautography Studies
Table 2: Representative Antimicrobial Activity Data from HPTLC-Bioautography Studies
| Natural Product Source | Test Microorganism | Key Active Compounds Identified | Potency (MIC or MED) | Citation |
|---|---|---|---|---|
| Ligusticum chuanxiong essential oil | Candida albicans | Ligustilide, Senkyunolide A | MIC: 0.5-2.0 mg/mL (essential oil) | [45] |
| Serbian propolis | Listeria monocytogenes | Multiple phenolic compounds | MIC: 0.1 mg/mL (most active sample) | [42] |
| Serbian propolis | Staphylococcus aureus | Multiple phenolic compounds | MIC: 0.5 mg/mL (most active sample) | [42] |
| Manuka leaf extracts | Staphylococcus aureus | Grandiflorone | MED: 0.29-0.59 μg/cm² | [44] |
| Manuka leaf extracts | Escherichia coli | Grandiflorone | MED: 2.34-4.68 μg/cm² | [44] |
| Polyherbal MM-24 formulation | Gram-positive & Gram-negative bacteria | Phenolics and flavonoids | MIC: 3.1-12.5 mg/mL | [12] |
Workflow Integration and Advanced Applications
Integrated HPTLC-Bioautography Workflow
The following diagram illustrates the comprehensive workflow for antimicrobial compound detection using HPTLC-bioautography, incorporating subsequent compound identification steps:
Advanced Integration and Biochemometrics
Modern HPTLC-bioautography increasingly incorporates advanced analytical techniques and data analysis methods:
HPTLC-MS Integration: Following bioautography, active zones can be directly eluted into a mass spectrometer using dedicated TLC-MS interfaces, enabling rapid structural characterization of antimicrobial compounds without extensive purification [43] [11]. This integration has been successfully applied in studies of Salvia species, where bioactive diterpenes including rosmanol methyl ether and carnosic acid were identified [43].
Biochemometric Analysis: Multivariate statistical methods such as Partial Least Squares (PLS) regression can correlate HPTLC fingerprint data with antimicrobial activity, highlighting specific chromatographic peaks potentially responsible for bioactivity [42]. This approach was used in propolis research to identify phenolic compounds correlated with antimicrobial effects against various bacterial strains [42].
Multi-Modal Detection Platforms: Recent advances include coupling HPTLC with Surface-Enhanced Raman Spectroscopy (SERS) and Near-Infrared Spectroscopy (NIR) for enhanced molecular fingerprinting of active compounds directly on the plate [11]. These "HPTLC+" platforms provide complementary chemical information that supports comprehensive compound characterization.
Troubleshooting and Method Optimization
Common Technical Challenges and Solutions
Poor Zone Definition: For Gram-negative bacteria like E. coli that are osmotically sensitive, incorporate a fixation step using 0.85% NaCl with 0.2% glutaraldehyde before INT staining to improve zone clarity [44].
Weak Microbial Growth: Optimize nutrient concentration in the spraying suspension and ensure proper humidity during incubation. Adding low concentrations of glucose (0.2-0.5%) to the microbial suspension can enhance growth intensity [41].
High Background Staining: Optimize INT concentration and incubation time; excessive INT can lead to high background, while insufficient INT produces weak staining.
Compound Deactivation: Some antimicrobial compounds may be deactivated during chromatography or by reagents in the bioautography process. Include positive controls with known antimicrobials to validate the assay system.
HPTLC-bioautography represents a powerful, cost-effective technology for the direct detection of antimicrobial compounds in complex mixtures. Its unique capacity to localize biological activity directly on the chromatographic plate makes it invaluable for natural product screening, drug discovery, and the standardization of bioactive preparations. When integrated with modern analytical techniques such as mass spectrometry and chemometric analysis, HPTLC-bioautography provides a comprehensive platform for effect-directed discovery and characterization of antimicrobial agents.
The continued evolution of "HPTLC+" platforms, incorporating advanced detection modalities and green chemistry principles, promises to further enhance the application of this technique in antimicrobial research and development [11]. As demonstrated through numerous applications across diverse natural products, HPTLC-bioautography stands as a cornerstone methodology for researchers seeking to efficiently bridge the gap between chemical complexity and biological activity in the search for novel antimicrobial agents.
The Unani system of medicine, with its centuries-old practice, employs numerous polyherbal formulations for treating various ailments. Iṭrīfal Ṣaghīr is one such preparation, traditionally used for its therapeutic properties. Despite their historical efficacy, Unani medicines face significant criticism due to a lack of standardized quality control protocols, leading to issues with contamination, adulteration, and batch-to-batch variation [46] [47]. This challenge is exacerbated by biodiversity and inconsistent collection practices of raw materials [47]. Modern analytical techniques, particularly High-Performance Thin-Layer Chromatography (HPTLC), have emerged as powerful tools for the standardization of herbal medicines by providing unique chemical fingerprints that ensure identity, purity, and quality [48] [49]. This case study details the application of HPTLC fingerprinting for the standardization of Iṭrīfal Ṣaghīr, executed within the broader research context of standardizing bioactive antimicrobial compounds from Unani medicine.
Experimental Section
Materials and Reagents
The following materials and reagents are essential for the HPTLC analysis and quality control of Unani formulations.
Table 1: Key Research Reagent Solutions for HPTLC Analysis
| Reagent/Material | Function/Application | Specification/Example |
|---|---|---|
| HPTLC Plates | Stationary phase for chromatographic separation | Pre-coated aluminum sheets with silica gel 60 F₂₅₄ (5 µm particle size, 0.25 mm thickness) [13] [49] |
| Methanol, Ethanol | Extraction solvents for preparing sample solutions | HPLC or analytical grade [12] [50] |
| Solvent System Components | Mobile phase for developing chromatograms | Toluene, Ethyl acetate, Glacial acetic acid, Triethylamine [13] [49] |
| Reference Standards | Chemical markers for identification and quantification | Gallic acid, tannic acid, catechin, quercetin [48] |
| Derivatization Reagent | Visualizing agent for detecting specific compound classes | Anisaldehyde-sulfuric acid reagent or natural product reagent [49] |
Sample Preparation Protocol
- Raw Material Authentication: Procure all botanical ingredients from a certified source. Authenticate each plant material by a qualified botanist and deposit voucher specimens in a recognized herbarium for future reference [12] [50].
- Formulation Preparation: Prepare Iṭrīfal Ṣaghīr according to the classical Unani text or official formulary. The entire process should be documented as a Standard Operating Procedure (SOP) [49].
- Laboratory-Scale Batching: Prepare at least three separate batches of the formulation under identical conditions to assess reproducibility [47] [49].
- Extraction for HPTLC:
- Weigh exactly 5 g of the powdered Iṭrīfal Ṣaghīr formulation.
- Add 100 mL of methanol to a stoppered conical flask.
- Sonicate for 20 minutes or shake mechanically for 2 hours at room temperature.
- Filter the solution through Whatman No. 41 filter paper.
- Concentrate the filtrate to 20 mL using a rotary evaporator at low temperature (<50°C) or under a gentle stream of nitrogen [49].
- Standard Solution Preparation: Prepare stock solutions of reference standards (e.g., gallic acid, quercetin) at a concentration of 1 mg/mL in HPLC-grade methanol. Further dilute to working concentrations as required for the calibration curve [48].
HPTLC Fingerprinting and Analysis
The workflow for HPTLC fingerprinting is a systematic process to ensure consistent and reliable results.
HPTLC Experimental Workflow
- Instrumentation: A DESAGA Sarstedt Gruppe HPTLC system or equivalent, equipped with an automatic TLC applicator (e.g., CAMAG Linomat V), a twin-trough development chamber, and a TLC scanner (e.g., CAMAG TLC Scanner 3) with winCATS software or similar [13] [49].
- Application: Spot the prepared sample and standard solutions (e.g., 10 µL band-wise) on the HPTLC plate using the automatic applicator [49].
- Development: Develop the chromatogram in a twin-trough chamber previously saturated for 15-20 minutes with the mobile phase. A typical mobile phase for Unani formulations is a mixture of Toluene: Ethyl acetate: Methanol in a ratio of 7:2:1 (v/v/v) [49]. Other systems like Glacial acetic acid: Methanol: Triethylamine: Ethyl acetate (0.05:1.00:0.10:9.00) can also be optimized [13].
- Drying and Derivatization: Air-dry the developed plate completely in a fume hood. If needed, derivatize by dipping in or spraying with a suitable reagent (e.g., anisaldehyde-sulfuric acid) followed by heating at 105°C for optimal color development [49].
- Documentation and Scanning: Capture the chromatogram images under ultraviolet light at 254 nm and 366 nm, and in the visible range after derivatization. Perform densitometric scanning at the appropriate wavelength (e.g., 366 nm) to generate the fingerprint profile and quantify markers [49].
Complementary Standardization Parameters
A comprehensive standardization protocol extends beyond chromatographic fingerprinting to include the following quality control tests, performed on three batches of the formulation [47] [49]:
- Organoleptic Evaluation: Document the formulation's color, odor, taste, and shape [47].
- Physicochemical Analysis: Determine moisture content (Loss on Drying), total ash, acid-insoluble ash, and extractive values (water-soluble and alcohol-soluble) [47] [49].
- Safety Profiling: Conduct heavy metal analysis, aflatoxin testing, pesticidal residue analysis, and microbial load count (total bacterial and fungal) to ensure the formulation is safe for therapeutic use [47] [49].
Results and Data Analysis
HPTLC Fingerprint Profile
The HPTLC fingerprint of the methanolic extract of Iṭrīfal Ṣaghīr, when scanned at 366 nm, should reveal a characteristic pattern of bands. A well-standardized formulation will show a consistent and reproducible fingerprint across all manufactured batches. In a related study on the Unani formulation Qurs-e-Luk, the HPTLC densitogram showed eleven distinct peaks at Rf values of 0.01, 0.08, 0.12, 0.27, 0.31, 0.40, 0.52, 0.61, 0.74, 0.79, and 0.91, demonstrating the level of detail achievable with this technique [49]. Similarly, the developed method for Iṭrīfal Ṣaghīr should aim to resolve and document its unique compound profile.
Quantitative Data and Physicochemical Standards
The quantitative data from physicochemical tests and HPTLC analysis should be consolidated for easy comparison and to establish acceptance criteria. The following table summarizes hypothetical but representative data for Iṭrīfal Ṣaghīr, based on typical results from standardized Unani formulations [47] [49].
Table 2: Standardization and Quality Control Parameters for Iṭrīfal Ṣaghīr (n=3 batches)
| Parameter | Batch 1 | Batch 2 | Batch 3 | Acceptance Criteria |
|---|---|---|---|---|
| Organoleptic Properties | ||||
| Color | Dark Yellow | Dark Yellow | Dark Yellow | Dark Yellow |
| Odor | Aromatic | Aromatic | Aromatic | Characteristic Aromatic |
| Physicochemical Tests | ||||
| Average Weight (mg) | 524.7 ± 1.72 | 523.5 ± 1.80 | 525.9 ± 1.65 | 520 - 530 mg |
| Loss on Drying (% w/w) | 7.50 ± 0.10 | 7.55 ± 0.15 | 7.48 ± 0.12 | NMT 10% |
| Total Ash (% w/w) | 6.80 ± 0.20 | 6.90 ± 0.25 | 6.85 ± 0.22 | NMT 8% |
| Alcohol Soluble Extractive (% w/w) | 27.54 ± 0.54 | 27.57 ± 0.32 | 26.92 ± 0.25 | NLT 25% |
| Water Soluble Extractive (% w/w) | 38.49 ± 0.20 | 37.38 ± 0.38 | 39.82 ± 0.13 | NLT 35% |
| Disintegration Time (min) | 16.5 | 17.0 | 16.0 | NMT 30 min |
| HPTLC Quantification | ||||
| Gallic Acid Content (% w/w) | 0.15 ± 0.02 | 0.14 ± 0.01 | 0.16 ± 0.02 | NLT 0.1% |
| Safety Tests | ||||
| Total Bacterial Count (CFU/g) | < 10⁵ | < 10⁵ | < 10⁵ | As per WHO guidelines |
| Heavy Metals (e.g., Pb, Cd) | Below limit | Below limit | Below limit | As per WHO guidelines |
Method Validation
The developed HPTLC method should be validated as per International Council for Harmonisation (ICH) guidelines to ensure its reliability and reproducibility for quantitative analysis [13] [48]. The relationship between analyte concentration and detector response is a critical component of this validation.
HPTLC Method Validation Parameters
For instance, a validated method for gallic acid in an Itrifal formulation might show linearity in the range of 0.03–3.00 µg/band with a correlation coefficient (R²) greater than 0.998, and precision with an RSD of less than 2% for the peak areas [13] [48].
Discussion
Integration with Bioactive Antimicrobial Compound Research
The standardization of Iṭrīfal Ṣaghīr via HPTLC is a critical step in correlating its chemical profile with its purported antimicrobial activity. The fingerprint ensures that the complex mixture of bioactive compounds is consistent across batches, which is a fundamental prerequisite for reliable biological assays [12]. A strong negative correlation between Total Phenolic Content (TPC) and Total Flavonoid Content (TFC) with IC₅₀ values in DPPH and β-carotene bleaching assays has been established in polyherbal formulations, indicating that these classes of compounds are major contributors to antioxidant activity [12]. Since antioxidant capacity often complements antimicrobial action by neutralizing reactive oxygen species that can impede healing, standardizing for these phytoconstituents indirectly supports the formulation's overall efficacy in managing infections and promoting wound healing [12].
Analytical Advantages of HPTLC
HPTLC is exceptionally suited for the quality control of Unani medicines. Its key advantages include:
- High Throughput: Multiple samples and standards can be analyzed simultaneously on a single plate, reducing analysis time and cost [13] [49].
- Flexibility in Detection: The option to use various derivatization reagents and scanning wavelengths allows for the detection of a wide range of compounds, from phenolics and flavonoids to alkaloids and terpenes [50] [49].
- Cost-Effectiveness: Compared to HPLC, HPTLC requires less solvent consumption and simpler sample preparation, making it an economically viable option for routine quality control in laboratories [13].
This application note demonstrates a comprehensive and robust protocol for standardizing the Unani formulation Iṭrīfal Ṣaghīr using HPTLC fingerprinting. The methodology encompasses full qualitative and quantitative analysis, including detailed sample preparation, chromatographic development, and validation steps. The integration of HPTLC with other physicochemical and safety parameters provides a holistic quality profile of the formulation. The data generated through this protocol ensure batch-to-batch consistency, authenticate the formulation, and lay a scientifically sound foundation for its further pharmacological evaluation, particularly in the realm of bioactive antimicrobial compounds. This approach significantly contributes to the validation, quality assurance, and global acceptance of Unani medicines.
HPTLC-DPPH Bioautography for Simultaneous Antioxidant and Antimicrobial Profiling
High-performance thin-layer chromatography (HPTLC) coupled with bioautography represents an advanced methodological platform for the simultaneous profiling of antioxidant and antimicrobial compounds in complex biological samples. This integrated approach combines the superior separation capabilities of HPTLC with targeted biological activity detection, providing a powerful tool for natural product research and drug discovery [51]. Within the broader context of standardizing bioactive antimicrobial compounds, HPTLC-bioautography serves as a reliable technique for fingerprinting complex mixtures while simultaneously localizing and identifying constituents with specific biological activities [51] [52]. The DPPH (2,2-diphenyl-1-picrylhydrazyl) bioautography method has emerged as a particularly valuable technique for direct visualization of free radical scavenging compounds separated on HPTLC plates, while direct bioautography can be employed for antimicrobial assessment [52]. This application note provides detailed protocols and analytical frameworks for implementing these techniques within a comprehensive research strategy for bioactive compound standardization.
Principles and Applications of HPTLC-Bioautography
Fundamental Principles
HPTLC-bioautography integrates the physical separation capabilities of chromatographic methods with biological detection systems. The technique operates on the principle that compounds separated on an HPTLC plate can be directly assessed for biological activity through specific detection reagents or biological systems [51]. For antioxidant screening, the stable free radical DPPH• is employed as a derivatization agent, which produces purple zones against a yellow background where reducing compounds are present [52]. The resulting chromogenic reaction allows for direct visualization and quantification of radical scavenging compounds based on spot intensity and Rf values [52].
For antimicrobial profiling, three principal bioautography methods have been established: agar diffusion, direct bioautography, and agar overlay bioautography [51]. Direct bioautography (DB), the most frequently employed approach, involves spraying a pathogenic microorganism suspension directly onto the developed HPTLC plate, followed by incubation in a humid environment. Microbial growth inhibition zones indicate the presence of antimicrobial compounds, enabling direct correlation between chemical separation and biological activity [51].
Research Applications
The HPTLC-DPPH bioautography platform has demonstrated utility across multiple research domains:
- Medicinal plant analysis: Identification and standardization of antioxidant and antimicrobial compounds in plant extracts [2] [53]
- Quality control: Authentication of botanical materials and detection of adulterants [30] [54]
- Bioactive compound discovery: Rapid screening of complex mixtures for novel therapeutic agents [55] [56]
- Chemical fingerprinting: Differentiation of closely related species based on their bioactivity profiles [54]
Table 1: Representative Applications of HPTLC-Bioautography in Natural Product Research
| Application Domain | Sample Type | Bioactivity Assessed | Key Findings | Reference |
|---|---|---|---|---|
| Plant Metabolite Profiling | Nymphaea nouchali seeds | Antimicrobial | Catechin (3.06%) identified as major antimicrobial compound | [2] |
| Antioxidant Screening | Chamaenerion latifolium | Antioxidant | Higher phenolic content in ethanol extract (267.48 mg GAE/g) correlated with superior antioxidant activity | [53] |
| Honey Authentication | Monofloral honeys | Chemical fingerprinting | Unique HPTLC patterns successfully differentiated botanical origins | [30] |
| Enzyme Inhibition | Myrmecodia platytyrea | α-Amylase inhibition | Stigmasterol content correlated with enzyme inhibitory activity (R = 0.95) | [52] |
| Species Differentiation | Angelica dahurica varieties | Antioxidant | 2D-HPTLC with bioautography distinguished closely related species | [54] |
Experimental Protocols
HPTLC-DPPH Protocol for Antioxidant Profiling
Materials and Equipment
- HPTLC silica gel 60 F254 plates (20 × 10 cm or 20 × 20 cm)
- Automatic TLC Sampler (e.g., CAMAG ATS 4)
- Automated Developing Chamber (e.g., CAMAG ADC2)
- TLC Visualizer or densitometer
- DPPH• (2,2-diphenyl-1-picrylhydrazyl) solution (0.4% w/v in methanol)
- Micropipettes and sample vials
- Mobile phase components (HPLC grade)
Sample Preparation
- Prepare plant extracts using appropriate solvents (ethanol, methanol, or ethyl acetate recommended) [53]
- Filter extracts through 0.45 μm membrane filters
- Prepare standard solutions of reference compounds (e.g., gallic acid, catechin, quercetin) at 1 mg/mL concentration [2]
Application and Chromatography
- Pre-wash HPTLC plates with methanol and activate at 100°C for 30 minutes
- Apply samples as 8 mm bands, 8 mm from lower edge, using nitrogen spray technique
- Maintain minimum distance of 2 mm between tracks
- Develop plates in pre-saturated chamber with optimized mobile phase (e.g., n-hexane:ethyl acetate:acetic acid, 20:9:1 for medium polarity compounds) [52]
- Dry developed plates completely at room temperature
DPPH Derivatization and Analysis
- Immerse developed plate in 0.4% DPPH• solution for 1 second using chromatogram immersion device
- Incubate plate in dark for 30 minutes at room temperature
- Capture images using TLC visualizer under consistent lighting conditions
- Analyze plates using densitometry at 517 nm or digital image analysis software
- Calculate relative antioxidant activity based on spot intensity and area
HPTLC-DPPH Bioautography Workflow
Direct Bioautography Protocol for Antimicrobial Profiling
Materials and Equipment
- Developed HPTLC plate (post-chromatography)
- Microbial suspensions (adjusted to 10^6 CFU/mL for bacteria, 10^5 spores/mL for fungi)
- Nutrient broth (Mueller Hinton for bacteria, Sabouraud for fungi)
- Spray apparatus or immersion device
- Humid incubation chamber
- Tetrazolium salts (e.g., MTT, resazurin) for viability staining
Procedure
- Prepare microbial suspensions in appropriate nutrient media [2] [55]
- Transfer developed HPTLC plate to sterile environment
- Spray microbial suspension evenly across plate surface using sterile spray bottle or immerse plate briefly in suspension
- Incubate plate in humid chamber at 37°C for 18-24 hours (bacteria) or 48-72 hours (fungi)
- For enhanced visualization, spray with tetrazolium dye solution (0.2 mg/mL MTT)
- Incubate additional 2-4 hours until viable microbial colonies develop color
- Document inhibition zones as clear areas against colored background
Interpretation
- Antimicrobial compounds appear as clear zones against colored background
- Rf values of active compounds correlate with inhibition zones
- Activity intensity can be semi-quantified based on zone size and clarity
Advanced Methodological Approaches
Two-Dimensional HPTLC Bioautography
For complex samples with co-eluting compounds, two-dimensional HPTLC provides enhanced separation capacity. The technique employs two different mobile phases applied in perpendicular directions, significantly improving resolution [54]. In application to Angelicae Dahuricae Radix analysis, 2D-HPTLC successfully resolved overlapping compounds that were indistinguishable in one-dimensional systems, particularly differentiating isoimperatorin (x = 16.5, y = 16.0) from suberosin (x = 14.5, y = 15.5) [54].
HPTLC-MS Integration
Coupling HPTLC with mass spectrometry enables direct structural characterization of bioactive compounds. After bioautography analysis, zones of interest can be eluted or directly analyzed using mass spectrometry interfaces [56]. This approach was successfully employed in analysis of Sphaeranthus indicus, where bioautography identified antimicrobial bands at Rf 0.92 and 1.0, with subsequent HPTLC-MS analysis identifying thymol (Rf 0.45) as an active component [56].
Table 2: Key Bioactive Compounds Identified Through HPTLC-Bioautography Approaches
| Compound Class | Specific Compounds | Biological Activity | Plant Source | Quantification Method | |
|---|---|---|---|---|---|
| Phenolic Acids | Gallic acid, Chlorogenic acid | Antioxidant, Antimicrobial | Chamaenerion latifolium | HPLC-UV-ESI/MS | [53] |
| Flavonoids | Catechin, Quercetin | Antioxidant, Antimicrobial | Nymphaea nouchali | HPTLC densitometry | [2] |
| Coumarins | Imperatorin, Isoimperatorin | Antioxidant | Angelica dahurica | 2D-HPTLC | [54] |
| Sterols | Stigmasterol | α-Amylase inhibition | Myrmecodia platytyrea | HPTLC densitometry | [52] |
| Terpenoids | Thymol | Antimicrobial | Sphaeranthus indicus | HPTLC-MS | [56] |
Essential Research Reagents and Materials
Table 3: Essential Research Reagent Solutions for HPTLC-Bioautography
| Reagent/Material | Specification | Function | Example Application | |
|---|---|---|---|---|
| HPTLC Plates | Silica gel 60 F254, glass-backed | Stationary phase for compound separation | All separation applications | [52] |
| DPPH• Solution | 0.4% (w/v) in methanol | Free radical source for antioxidant detection | Antioxidant bioautography | [52] |
| Microbial Media | Mueller Hinton Agar, Potato Dextrose Broth | Microbial growth support | Antimicrobial bioautography | [2] [55] |
| Tetrazolium Salts | MTT, Resazurin (0.02% w/v) | Microbial viability indicator | Visualization of inhibition zones | [2] |
| Mobile Phase | n-hexane:ethyl acetate:acetic acid (20:9:1) | Compound separation | Medium polarity compounds | [52] |
| Derivatization Reagent | Anisaldehyde-sulfuric acid | Compound visualization | Natural product detection | [30] |
| Reference Standards | Gallic acid, catechin, quercetin | Quantification and method validation | Antioxidant standardization | [2] [53] |
Method Validation and Standardization
Validation Parameters
For quantitative applications, HPTLC-bioautography methods require rigorous validation:
- Linearity: Evaluate over appropriate concentration range (e.g., 1.0-12.0 μg/band for stigmasterol) [52]
- Specificity: Confirm separation from potentially interfering compounds
- Repeatability: Assess through relative standard deviation (%RSD) of replicate analyses
- Sensitivity: Determine limit of detection (LOD) and quantification (LOQ)
Quantitative Analysis
Digital image analysis and densitometry provide complementary approaches for quantification. For stigmasterol analysis, both methods demonstrated strong linearity (R² = 0.98) with LOD of 0.4 μg and LOQ of 1.2-1.4 μg [52]. Calibration curves are established using reference standards applied directly to HPTLC plates.
DPPH Antioxidant Detection Mechanism
HPTLC-DPPH bioautography represents a sophisticated analytical platform that effectively bridges chemical separation and biological activity assessment. The methodology provides researchers with a powerful tool for rapid screening and standardization of complex natural product mixtures, particularly valuable in antimicrobial drug discovery and quality control of botanical preparations. Through integration with advanced detection systems including mass spectrometry and two-dimensional separation approaches, HPTLC-bioautography continues to evolve as a cornerstone technique in natural product research and development.
Within natural product research, a significant challenge lies in the efficient isolation of bioactive compounds from complex matrices without repeatedly isolating known or inactive constituents. This protocol details an integrated methodology that couples Fast Centrifugal Partition Chromatography (FCPC) with High-Performance Thin-Layer Chromatography (HPTLC) profiling to create a streamlined workflow for the targeted isolation of antimicrobial compounds. This approach is situated within the broader thesis that HPTLC fingerprinting is a powerful tool for the standardization of bioactive antimicrobial compound research. By integrating the high-resolution fractionation capabilities of FCPC with the rapid, high-throughput profiling of HPTLC, researchers can significantly accelerate the dereplication and identification process [57] [58]. The protocol leverages multivariate statistical analysis and the HeteroCovariance Approach (HetCA) to correlate chemical profiles with biological activity, enabling a targeted isolation strategy that minimizes time and resource expenditure [32].
Research Reagent Solutions and Essential Materials
The following table catalogs the key reagents, materials, and instrumentation required for the successful execution of this integrated protocol.
Table 1: Essential Research Reagents and Materials
| Item | Function/Application | Specific Examples / Notes |
|---|---|---|
| FCPC System | Solvent-system-based fractionation without a solid stationary phase. | Two-phase solvent system (e.g., n-hexane-ethyl acetate-methanol-water) [59] [58]. |
| HPTLC System | High-resolution chromatographic profiling and fingerprinting of fractions. | Includes semi-automated sample applicator, development chamber, and visualizer/densitometer [32]. |
| Chromatography Plates | Solid support for compound separation. | HPTLC silica gel plates (e.g., Silica gel GF254) [2]. |
| Bioautography Assays | Direct detection of bioactive zones on the HPTLC plate. | Agar-overlay with test strains (e.g., S. aureus, E. coli); DPPH for antioxidants [2] [27]. |
| Multivariate Statistics Software | Chemometric analysis to correlate HPTLC data with bioactivity. | Used for HetCA and sHetCA to identify bioactive compounds [57] [32]. |
| Standard Solvents & Reagents | Extraction, fractionation, and derivatization. | Methanol, ethanol, ethyl acetate, n-hexane, chloroform; derivatization reagents like sulfuric vanillin [2] [32]. |
| NMR Spectroscopy | Structural elucidation of purified compounds. | 600 MHz spectrometer for confirming identity post-isolation [59] [57]. |
Integrated FCPC-HPTLC Workflow Protocol
This section provides a detailed, step-by-step methodology for coupling FCPC fractionation with HPTLC analysis for the targeted isolation of antimicrobial compounds from a complex plant extract.
Sample Preparation and Initial Extraction
- Plant Material Processing: Air-dry the aerial parts of the plant material (e.g., Paeonia mascula) and coarsely powder them [58].
- Accelerated Solvent Extraction (ASE): Load the powdered material into an ASE cell. Perform extraction with a suitable solvent, such as a hydroalcoholic mixture (e.g., methanol-water 80:20, v/v) at a temperature of 70°C and a pressure of 1500 psi [58].
- Extract Concentration: Evaporate the combined extracts to dryness under reduced pressure using a rotary evaporator. The resulting dry extract is stored at 4°C until further use.
FCPC Fractionation
- Solvent System Selection:
- Prepare a two-phase solvent system. A commonly used system for medium-polarity natural products is n-hexane-ethyl acetate-methanol-water in a ratio determined by the extract's chemistry (e.g., 4:5:4:5, v/v) [58].
- Equilibrate the solvent system in a separation funnel, and separate the upper (organic) and lower (aqueous) phases shortly before use.
- FCPC Operation:
- Fill the FCPC column with the stationary phase (e.g., the aqueous phase).
- Inject the crude extract (e.g., 500 mg dissolved in 5 mL of a 1:1 mixture of both phases) into the sample loop.
- Initiate the rotation of the column (e.g., at 1600 rpm) and simultaneously pump the mobile phase (e.g., the organic phase) at a defined flow rate (e.g., 3 mL/min) [58].
- Collect fractions (e.g., 4-5 mL per tube) based on elapsed time or volume.
- Fraction Pooling: Analyze the collected fractions by HPTLC. Based on the chemical similarity of their chromatographic profiles, pool fractions into larger, consolidated groups for subsequent bioactivity testing [58].
HPTLC Fingerprinting and Bioactivity Analysis
- HPTLC Plate Preparation: Activate pre-coated HPTLC silica gel plates by heating at 100°C for 20 minutes.
- Sample Application: Using a semi-automated applicator (e.g., CAMAG Linomat 5), apply the pooled FCPC fractions and appropriate standards as 8 mm bands, 8 mm from the lower edge of the plate. The application rate should be standardized (e.g., 150 nL/s) [27].
- Chromatogram Development:
- Develop the plate in a twin-trough chamber pre-saturated with the mobile phase for 20 minutes. A typical mobile phase for medium-polarity compounds could be toluene-ethyl acetate-formic acid (e.g., 6:5:1, v/v/v) [27].
- Develop the plate to a distance of 70 mm from the point of application.
- Derivatization and Documentation:
- Dry the developed plate completely.
- Document the plate under UV light at 254 nm and 366 nm.
- Derivatize the plate by dipping it or spraying it with a reagent such as sulfuric vanillin. Heat the plate at 100°C for 3-5 minutes until bands appear, and capture the image under white light [32].
- Bioautography for Antimicrobial Activity:
- Develop two identical HPTLC plates under the same conditions.
- Use one plate for chemical profiling (as in step 4). The second plate is used for bioautography.
- For the bioautography plate, after development and drying, carefully overlay it with a sterile, molten microbial agar medium inoculated with a test pathogen (e.g., Staphylococcus aureus or Pseudomonas aeruginosa) [2].
- Incub the plate in a humid chamber at 37°C for 24 hours.
- Zones of inhibition appear as clear areas against a background of microbial growth. Visualize these zones by applying a tetrazolium dye (e.g., MTT), which is converted to a purple formazan by living microbes, making the inhibition zones visibly clear [2].
Data Integration and Targeted Isolation
- Correlation of Chemical and Bioactivity Data:
- Use chemometric software to align the HPTLC fingerprint (chemical profile) of the pooled fractions with their corresponding antimicrobial activity data from bioautography or microdilution assays (e.g., MIC values) [58] [32].
- Implement the sparse HeteroCovariance Approach (sHetCA) to calculate the covariance between the HPTLC densitogram data and the bioactivity results. This generates a "pseudospectrum" highlighting the chromatographic zones (Rf values) that are statistically correlated with the observed antimicrobial effect [32].
- Targeted Isolation:
- Based on the sHetCA output, identify the specific HPTLC band(s) responsible for bioactivity.
- Scale up the FCPC fractionation, focusing on the fractions enriched with the target compound.
- Subject the enriched fraction to semi-preparative or preparative HPLC using the mobile phase conditions optimized from the HPTLC results to isolate the pure bioactive compound(s) [59].
- Structural Elucidation: Identify the structure of the purified active compound(s) using techniques such as NMR (1D and 2D) and high-resolution mass spectrometry (HRMS) [59].
Quantitative Data and Experimental Results
The following tables summarize typical quantitative data and experimental outcomes generated through the application of this integrated protocol.
Table 2: Quantitative Antibacterial Activity of Isolated Compounds from Solidago gigantea Leaf Extract [59]
| Compound Name | B. subtilis subsp. spizizenii (IC50, µg/mL) | R. fascians (IC50, µg/mL) |
|---|---|---|
| Solidagoic Acid H (1) | 64.4 | 32.3 |
| Solidagoic Acid I (3) | 64.1 | 33.5 |
Table 3: Performance Metrics of the PLANTA Protocol for Bioactive Compound Identification in an Artificial Extract [57]
| Metric | Performance |
|---|---|
| Detection Rate of Active Metabolites | 89.5% |
| Correct Identification Rate | 73.7% |
Table 4: Antimicrobial Activity and Phenolic Content of Nymphaea nouchali Seed Extract [2]
| Parameter | Result |
|---|---|
| Zone of Inhibition | 25 mm (P. aeruginosa), 20 mm (S. aureus), 19 mm (C. albicans) |
| Minimum Inhibitory Concentration (MIC) | 0.03 mg/mL (K. pneumoniae, S. dysenteriae, E. coli); 0.31 mg/mL (C. albicans, T. mentagrophytes) |
| HPTLC Quantified Phenolics | Catechin (3.06%), Gallic Acid (0.27%), Quercetin (0.04%) |
Workflow and Signaling Pathway Diagrams
The following diagram illustrates the integrated experimental workflow, from initial extraction to the identification of bioactive antimicrobial compounds.
Integrated FCPC-HPTLC Workflow
This workflow demonstrates the sequential and synergistic integration of FCPC and HPTLC, culminating in data-driven targeted isolation.
Troubleshooting HPTLC Analysis: Overcoming Common Challenges in Antimicrobial Compound Detection
Mobile Phase Optimization Strategies Using Systematic Approaches
In High-Performance Thin-Layer Chromatography (HPTLC), the mobile phase is a critical determinant of separation efficiency, selectivity, and analytical throughput. For researchers standardizing bioactive antimicrobial compounds, mobile phase optimization presents particular challenges due to the complex chemical nature of natural product extracts. A systematically optimized mobile phase ensures reproducible HPTLC fingerprints that can reliably identify active constituents and detect adulterants, which is essential for quality control in drug development [60] [61].
This application note provides detailed protocols for systematic mobile phase optimization strategies tailored specifically for HPTLC fingerprinting of antimicrobial plant extracts and complex herbal preparations. The approaches integrate theoretical principles with practical experimental design to achieve robust, reproducible separations suitable for standardized antimicrobial compound research.
Theoretical Foundations of Mobile Phase Optimization
Mechanisms of Separation in HPTLC
Mobile phase optimization requires understanding how compounds interact with both stationary and mobile phases. In normal-phase HPTLC (the most common configuration for natural product analysis), the silica gel stationary phase is polar, while mobile phase polarity determines migration and separation efficiency [62]. The relative interactions between a compound, the stationary phase, and the mobile phase determine the retardation factor (Rf), calculated as the distance traveled by the compound divided by the distance traveled by the solvent front [62].
For antimicrobial compounds which often include phenolics, flavonoids, alkaloids, and quinones with diverse polarities, mobile phase composition must be carefully calibrated to achieve optimal resolution (Rf values between 0.2 and 0.8) while maintaining band compactness [63] [60].
Key Parameters for Mobile Phase Optimization
Table 1: Critical Parameters for Mobile Phase Optimization
| Parameter | Influence on Separation | Optimal Range for Antimicrobial Compounds |
|---|---|---|
| Solvent Polarity | Determines migration distance; affects compound solubility and interaction with stationary phase | Adjusted to achieve Rf values between 0.2-0.8 |
| pH Modifiers | Impacts ionization state of acidic/basic compounds; alters retention and band shape | pH 6.5-7.5 for most antimicrobial phenolics and alkaloids |
| Solvent Ratio | Fine-tunes selectivity and resolution between closely-eluting compounds | Binary/ternary mixtures with 5-20% modifier variations |
| Buffer Concentration | Controls ionization and reduces tailing of ionizable compounds | 0.1-0.5 M for ammonium acetate/formate buffers |
| Development Distance | Affects resolution and band separation; longer distances improve resolution but increase diffusion | 70-80 mm for standard HPTLC plates |
Systematic Optimization Methodologies
PRISMA Model for Mobile Phase Optimization
The PRISMA model provides a systematic three-dimensional approach to mobile phase optimization, considering solvent strength, selectivity, and proportion. This model is particularly valuable for complex antimicrobial extracts containing multiple bioactive constituents with varying polarities.
Optimization Workflow:
Select Solvent Strength: Begin with a single solvent of medium strength (e.g., ethyl acetate or acetone) and adjust strength with modifiers until target Rf range (0.3-0.7) is achieved for key antimicrobial markers.
Optimize Selectivity: Test solvents from different selectivity groups (according to Snyder's solvent selectivity triangle) while maintaining similar solvent strength. Common selectivity groups for antimicrobial compounds include:
- Group I: Aliphatic ethers and amines (diethyl ether, tetrahydrofuran)
- Group V: Alcohols (methanol, ethanol)
- Group VII: Aromatic hydrocarbons (toluene, xylene)
- Group VIII: Halogenated compounds (chloroform, dichloromethane)
Fine-tune Proportions: Use statistical experimental designs (e.g., mixture designs or simplex lattice) to optimize final solvent proportions for maximum resolution of critical antimicrobial compound pairs.
Visualization of Systematic Optimization Workflow:
pH-Based Optimization Strategy for Ionizable Antimicrobial Compounds
Many antimicrobial compounds (alkaloids, phenolic acids) contain ionizable functional groups whose retention behavior is highly pH-dependent. Systematic pH optimization is crucial for achieving symmetric band shapes and consistent migration.
Protocol: pH Scouting Gradient Method
Preparation of pH-Modified Mobile Phases:
- Prepare ammonium acetate buffer solutions across pH range 4.0-8.0 in 0.5 unit increments
- Create binary mobile phases with fixed organic:aqueous ratio (e.g., 90:10 chloroform:buffer)
- Pre-equilicate HPTLC plates with buffer vapor for 30 minutes before development
Development and Evaluation:
- Apply antimicrobial standard mixture and unknown extract to each pH condition
- Develop plates in twin-trough chamber pre-saturated with mobile phase
- Document Rf values, band symmetry, and resolution factors for all detectable antimicrobial compounds
- Select optimal pH that provides best compromise between resolution, symmetry, and analysis time
Case Example: In a published method for simultaneous quantification of hydroxyzine HCl, ephedrine HCl, and theophylline, researchers optimized the mobile phase at pH 6.5 using chloroform-ammonium acetate buffer (9.5:0.5, v/v) adjusted with ammonia solution. This specific pH provided optimal ionization states for all three compounds, resulting in Rf values of 0.15, 0.40, and 0.65, respectively [63].
Experimental Protocols
Comprehensive Protocol: Mobile Phase Optimization for Complex Antimicrobial Extracts
Materials and Reagents
- HPTLC Plates: Silica gel 60 F254, 20 × 10 cm (Merck) [60]
- Solvents: HPLC grade water, methanol, ethanol, acetonitrile, ethyl acetate, chloroform, n-hexane, toluene
- Buffers: Ammonium acetate (0.1-1.0 M), ammonium formate (0.1-1.0 M), phosphate buffers (10-100 mM)
- pH Modifiers: Glacial acetic acid, formic acid, ammonia solution (25%), triethylamine
- Application Device: Automated TLC applicator (e.g., CAMAG Linomat V)
- Development Chamber: Automated developing chamber (ADC2) or twin-trough glass chamber
- Detection System: CAMAG TLC Scanner III with winCATS software
Step-by-Step Procedure
Initial Scouting with Universal Gradient:
- Spot test mixture containing antimicrobial standards (e.g., gallic acid, berberine, quercetin, thymol) and sample extract on 8 HPTLC plates
- Develop each plate with different pure solvents in order of increasing polarity: hexane → toluene → chloroform → ethyl acetate → acetone → methanol → water
- Evaluate migration distances and select 2-3 base solvents that bring target compounds to Rf 0.3-0.7
Binary Mixture Optimization:
- Prepare binary mixtures of selected base solvents in 10% increments (e.g., chloroform-methanol 90:10, 80:20, etc.)
- Develop plates and calculate resolution (Rs) between most critical pair of antimicrobial compounds
- Plot resolution values versus mobile phase composition to identify optimal ratio
Ternary Mixture Fine-Tuning:
- To the optimal binary mixture, add 1-5% of a third solvent from different selectivity group
- Test acidic (0.1-1% acetic acid), basic (0.1-1% ammonia), and neutral modifiers separately
- Evaluate improvement in band symmetry and resolution
Buffer Incorporation and pH Optimization:
- Replace water component with appropriate buffer (typically 0.1-0.5 M ammonium acetate)
- Test pH range based on pKa values of target antimicrobial compounds (typically pH 4-8)
- Select pH that provides symmetric bands and maximal resolution
Robustness Validation:
- Intentionally vary optimal mobile phase composition by ±2%
- Adjust pH by ±0.2 units
- Modify chamber saturation time by ±5 minutes
- Evaluate impact on Rf values and resolution (RSD of Rf should be <2%)
Visualization of Mobile Phase Optimization Parameters:
Rapid Screening Protocol for Multiple Antimicrobial Extracts
For laboratories requiring high-throughput screening of multiple antimicrobial plant extracts, this abbreviated protocol provides a standardized approach:
Preparation of Standardized Mobile Phase Library:
- Prepare 6 standardized mobile phase systems covering polarity range:
- Non-polar: Hexane-ethyl acetate (7:3, v/v)
- Medium-polarity I: Chloroform-methanol (9:1, v/v)
- Medium-polarity II: Ethyl acetate-methanol-water (8:1:1, v/v/v)
- Polar I: Ethyl acetate-methanol-water-acetic acid (6:1.5:1.5:1, v/v/v/v)
- Polar II: Chloroform-ammonium acetate buffer pH 6.5 (9.5:0.5, v/v) [63]
- Aqueous: n-Butanol-acetic acid-water (4:1:1, v/v/v)
- Prepare 6 standardized mobile phase systems covering polarity range:
Parallel Development:
- Apply standardized antimicrobial markers and unknown extracts to 6 HPTLC plates
- Develop each plate with one standardized mobile phase system
- Document chromatograms under UV 254 nm, UV 366 nm, and after derivatization
Mobile Phase Selection:
- Select the system providing best resolution of antimicrobial compounds of interest
- Proceed to fine-tuning if necessary
The Scientist's Toolkit: Essential Research Reagents
Table 2: Key Research Reagents for HPTLC Mobile Phase Optimization
| Reagent Category | Specific Examples | Function in Mobile Phase Optimization |
|---|---|---|
| Primary Solvents | Chloroform, ethyl acetate, methanol, ethanol, acetonitrile | Main components controlling solvent strength and selectivity |
| Buffer Systems | Ammonium acetate (0.1-1.0 M), ammonium formate, phosphate buffers | Control pH for ionizable antimicrobial compounds; reduce tailing |
| Acidic Modifiers | Formic acid (0.1-1%), acetic acid (0.1-1%), trifluoroacetic acid (0.05-0.1%) | Suppress ionization of acidic compounds; improve band shape |
| Basic Modifiers | Ammonia solution (0.1-1%), triethylamine (0.1-0.5%), diethylamine | Suppress ionization of basic compounds (e.g., alkaloids); reduce tailing |
| Stationary Phases | Silica gel 60 F254, RP-18, NH2, CN, DIOL | Complementary phases for challenging separations; orthogonal selectivity |
| Detection Reagents | Anisaldehyde-sulfuric acid, vanillin-sulfuric acid, ferric chloride, DPPH | Specific visualization of antimicrobial compounds (terpenes, phenolics) |
Applications in Antimicrobial Compound Research
Case Study: Optimization for Antidiabetic Plant Extract Profiling
In standardization of five antidiabetic plants, researchers developed customized mobile phases for each botanical to optimally separate bioactive antimicrobial markers [60]. For example:
- Gymnema sylvestre: Chloroform:methanol:water (7:3:0.5, v/v/v) effectively separated gymnemagenin from interfering compounds
- Pterocarpus marsupium: Toluene:ethyl acetate:formic acid (5:4:1, v/v/v) provided optimal resolution of pterostilbene
- Emblica officinalis: Ethyl acetate:formic acid:acetic acid:water (10:0.5:0.5:1.3, v/v/v/v) successfully separated gallic acid and other antimicrobial phenolics
The systematic optimization accounted for varying polarities of antimicrobial constituents across different plant species, demonstrating the need for customized rather than universal mobile phases.
Advanced Application: Multi-Color Scale Fingerprinting of Complex Formulations
For ultra-complex antimicrobial preparations like Sanwujiao Pills (containing six herbs for treating rheumatoid arthritis), researchers employed efficacy-oriented HPTLC fingerprinting with multi-color scale scanning [61]. This required:
- Primary Screening: Initial mobile phase optimization using PRISMA model
- Efficacy-Guided Refinement: Focusing separation on previously identified bioactive antimicrobial compounds
- Multi-Wavelength Detection: Establishing four characteristic fingerprints from five herbs guided by eight effective antimicrobial components
This approach enabled quality evaluation of 12 production batches, identifying eight components affecting preparation quality and establishing science-based quality control thresholds.
Troubleshooting and Technical Notes
Common Optimization Challenges and Solutions
Problem: Poor resolution of antimicrobial compounds with similar polarities. Solution: Incorporate solvents from different selectivity groups rather than simply adjusting polarity. Consider adding small percentages (0.1-0.5%) of amines for basic compounds or acids for acidic compounds.
Problem: Tailing of bioactive alkaloid bands. Solution: Increase buffer concentration to 0.3-0.5 M; adjust pH to at least 2 units away from compound pKa; consider adding competing bases like triethylamine (0.1-0.3%).
Problem: Inconsistent Rf values between runs. Solution: Standardize chamber saturation time (typically 20-30 minutes); control laboratory temperature and humidity; use fresh mobile phase preparations.
Problem: Multiple antimicrobial compounds co-eluting near solvent front. Solution: Decrease mobile phase polarity by increasing proportion of non-polar component; consider alternative stationary phase (RP-18) for highly non-polar antimicrobial compounds.
Method Validation Parameters
For regulatory acceptance of optimized HPTLC methods for antimicrobial compound standardization, validate these critical parameters [64]:
- Accuracy: Compare identification against authenticated reference standards
- Precision: Intra-day and inter-day reproducibility of Rf values (RSD < 2%)
- Specificity: Ability to distinguish target antimicrobial compounds from closely-related species
- Robustness: Consistent performance with deliberate variations in mobile phase composition (±2%), pH (±0.2 units), and development conditions
- Limit of Detection: Lowest detectable amount of key antimicrobial markers
Systematic mobile phase optimization is fundamental to developing reliable HPTLC fingerprints for standardization of bioactive antimicrobial compounds. The strategies outlined in this application note—from initial solvent screening to advanced multi-parameter optimization—provide researchers with robust methodologies for handling complex natural product extracts. By implementing these protocols, scientists can achieve reproducible, high-resolution separations that form the foundation of quality assurance programs for antimicrobial drug development from natural sources.
Resolving Co-elution Issues in Complex Herbal Extracts
In the pursuit of standardizing bioactive antimicrobial compounds from herbal extracts, researchers often encounter a significant analytical hurdle: co-elution. This phenomenon occurs when two or more compounds in a complex mixture migrate to the same position on a chromatographic plate, resulting in overlapping bands that impede accurate identification and quantification [11]. For scientists working with antimicrobial herbal profiles, such as those from Allium ascalonicum L. (shallot) and Coffea canephora (Robusta coffee), unresolved co-elution can obscure crucial active compounds, potentially leading to incomplete fingerprinting and misrepresentation of bioactivity [12].
High-performance thin-layer chromatography (HPTLC) has emerged as a powerful platform for the analysis of complex botanical samples due to its flexibility, cost-effectiveness, and capacity for parallel analysis [65] [66]. Modern HPTLC transcends its traditional role as a simple separation technique, evolving into a sophisticated multimodal analytical platform capable of overcoming co-elution challenges through strategic method optimization and hyphenation with advanced detection systems [11]. This Application Note provides detailed protocols and data-driven strategies to resolve co-elution issues in complex herbal extracts, specifically within the context of standardizing bioactive antimicrobial compounds.
Core Principles and Key Challenges
The HPTLC Advantage in Herbal Analysis
HPTLC offers several distinct advantages for analyzing complex herbal matrices, especially when dealing with co-elution:
- High Sample Throughput: Multiple samples and standards can be analyzed simultaneously on a single plate under identical conditions, ensuring consistent comparison and facilitating method optimization [66].
- Flexible Detection Schemes: The open-bed configuration of HPTLC allows for the sequential application of multiple detection methods, including chemical derivatization, biological assays (bioautography), and spectroscopic techniques to the same separation [11].
- Minimal Sample Preparation: HPTLC is relatively tolerant of partially purified extracts, reducing the need for extensive sample clean-up that can lead to the loss of bioactive compounds [65].
Co-elution in herbal extracts typically arises from:
- Structural Similarities: Compounds with closely related chemical structures (e.g., homologous series, isomers) often demonstrate similar affinities for the stationary and mobile phases [67].
- Matrix Complexity: Herbal extracts may contain hundreds of compounds across various chemical classes, including pigments, lipids, and sugars, which can interfere with the separation of target antimicrobial agents [11] [12].
- Suboptimal Chromatographic Conditions: Inappropriate mobile phase composition, stationary phase selection, or development conditions fail to exploit subtle differences in compound physicochemical properties [68].
Strategic Approaches to Resolve Co-elution
Mobile Phase and Stationary Phase Optimization
The primary strategy for resolving co-elution involves systematic optimization of chromatographic parameters.
Table 1: Mobile Phase Systems for Different Compound Classes
| Compound Class | Herbal Example | Mobile Phase Composition (v/v) | Resolution (Rₛ) Achieved | Citation |
|---|---|---|---|---|
| Steroidal Glycosides | Solanum nigrum L. | n-butanol: ethyl acetate: 10% acetic acid (5:3.5:1.5) | Baseline separation for solamargine, solasonine, solasodine | [67] |
| Sugars | Stingless Bee Honey | 1-butanol: 2-propanol: aqueous boric acid (5 mg/mL) (30:50:10) | Rₛ > 1.5 for trehalulose from other sugars | [68] |
| Phenolic Compounds | Fruit Peel Extracts | Variable based on specific polyphenols | Effective profiling of 12 phenolic compounds | [69] |
| Veterinary Drugs | Pharmaceutical Formulation | Glacial acetic acid: methanol: triethylamine: ethyl acetate (0.05:1.00:0.10:9.00) | Simultaneous quantification of florfenicol and meloxicam | [13] |
Protocol 1: Incremental Mobile Phase Optimization
- Initial Scouting: Test a range of solvent systems with different polarities and selectivities (e.g., hexane-ethyl acetate, chloroform-methanol, toluene-ethyl acetate-formic acid).
- pH Adjustment: For ionizable compounds (e.g., phenolic acids, alkaloids), add small amounts of acid (formic acid, acetic acid) or base (ammonia, triethylamine) to suppress ionization and improve band shape [67] [13].
- Fine-Tuning Ratios: Adjust mobile phase ratios in increments of 2-5% to achieve optimal resolution. Use the solvent optimization software if available.
- Multiple Development: Employ automated multiple development (AMD) where the plate is developed to different distances with the same solvent or with solvents of decreasing polarity to enhance separation [65].
Advanced HPTLC Hyphenation Techniques
When physical separation on the plate remains challenging, hyphenation with spectroscopic and spectrometric techniques provides a powerful solution for deconvoluting co-eluted bands.
Table 2: Hyphenated Techniques for Co-elution Resolution
| Technique | Principle | Best for Resolving Co-elution of | Sensitivity Enhancement | Citation |
|---|---|---|---|---|
| HPTLC-MS | In-situ extraction of analyte from band followed by mass spectral identification | Structurally similar compounds with different molecular weights | Low ng to pg range (depending on MS system) | [11] [67] |
| HPTLC-SERS | Surface-enhanced Raman scattering provides molecular fingerprints | Isomers, compounds with identical mass but different structures | Single-molecule detection (theoretical) | [11] |
| HPTLC-NIR | Non-destructive compositional profiling based on molecular vibrations | Compounds with different functional groups (e.g., OH, NH, C=O) | Milligram to microgram range | [11] |
| HPTLC-Bioautography | Direct biological activity screening on plate | Bioactive vs. inactive compounds with similar Rₓ values | Microgram range (depends on compound activity) | [11] [12] |
Protocol 2: HPTLC-MS Coupling for Band Identification
- Chromatographic Separation: Develop HPTLC plate using optimized conditions from Protocol 1. Do not apply derivatizing agents.
- Band Localization: Mark bands of interest under controlled UV light (254 nm or 366 nm) using a soft pencil.
- In-situ Extraction: Using a specialized TLC-MS interface, elute the marked band directly from the plate into the mass spectrometer with a suitable solvent (e.g., methanol, acetonitrile).
- Mass Spectrometric Analysis: Perform ESI-MS or APCI-MS analysis in positive or negative ion mode to obtain molecular weight and structural information through fragmentation [11] [67].
- Data Interpretation: Compare mass spectra with libraries or standards to identify co-eluting compounds that were unresolved in the chromatographic dimension.
Chemical Derivatization and Bioautography
Protocol 3: Sequential Derivatization for Selective Detection
- Plate Development: Separate sample extracts alongside standards on HPTLC silica gel 60 F₂₅₄ plates.
- Initial Documentation: Capture images under UV light (254 nm and 366 nm) and white light before derivatization.
- Targeted Derivatization:
- Post-Derivatization Documentation: Capture images after derivatization and compare with pre-derivatization images to identify compounds with different functional groups that co-eluted.
Protocol 4: HPTLC-Bioautography for Antimicrobial Compound Detection
- Chromatographic Separation: Develop HPTLC plate under optimized conditions. Do not apply chemical derivatization.
- Microbial Inoculation: Evenly spray the developed plate with a standardized suspension of test microorganisms (e.g., Staphylococcus aureus, Escherichia coli) in nutrient broth.
- Incubation: Place the inoculated plate in a humid chamber and incubate at 37°C for 18-24 hours.
- Viability Detection: Spray the plate with a tetrazolium salt solution (e.g., MTT, INT). Metabolically active bacteria will reduce the tetrazolium salt to colored formazan, except in zones where antimicrobial compounds are present [12].
- Inhibition Zone Analysis: Clear zones of inhibition indicate the presence of antimicrobial compounds, effectively resolving co-eluted bands where only one compound possesses bioactivity.
Experimental Workflow for Comprehensive Profiling
The following diagram illustrates a systematic workflow for resolving co-elution issues in complex herbal extracts, integrating the techniques and protocols discussed.
Figure 1: Systematic workflow for resolving co-elution issues in complex herbal extracts.
The Scientist's Toolkit: Essential Research Reagents and Materials
Table 3: Essential Research Reagents and Materials for HPTLC Analysis of Herbal Extracts
| Item | Specification/Recommended Type | Function in Analysis | Application Example |
|---|---|---|---|
| HPTLC Plates | Silica gel 60 F₂₅₄ (glass/alu backing), 5 μm particle size | High-resolution stationary phase | Standardized plates ensure reproducible Rₓ values [68] [13] |
| Sample Applicator | Semi-automated (e.g., CAMAG Linomat 5/6) | Precise, reproducible band application | Critical for accurate quantitative analysis [68] |
| Development Chamber | Automated Development Chamber (ADC) with humidity control | Controlled, reproducible mobile phase migration | Minimizes edge effects and ensures even development [68] |
| Mobile Phase Additives | Glacial acetic acid, triethylamine, boric acid | Modifies selectivity, suppresses ionization | Boric acid for sugar separation [68]; TEA for basic compounds [13] |
| Derivatization Reagents | Aniline-diphenylamine-H₃PO₄, Natural Product reagent, Fast Blue Salt B | Visualizes specific compound classes | Sugar detection in stingless bee honey [68] |
| Microbial Strains | Staphylococcus aureus, Escherichia coli (ATCC strains) | Bioautography for antimicrobial activity detection | Identification of antimicrobial bands in polyherbal formulations [12] |
| Mass Spectrometry Interface | TLC-MS Interface (e.g., CAMAG TLC-MS Interface) | Direct elution of bands to MS for identification | Structural elucidation of co-eluted steroidal glycosides [67] |
| HPTLC Software | visionCATS (CAMAG) or similar | Densitometric analysis, peak integration, data documentation | Essential for validation and quantitative analysis [68] [13] |
Resolving co-elution issues in complex herbal extracts demands a systematic, multi-faceted approach that leverages the full capabilities of modern HPTLC. Through strategic optimization of chromatographic conditions, implementation of hyphenated techniques, and application of targeted detection methods, researchers can effectively deconvolute complex mixtures and accurately standardize bioactive antimicrobial compounds. The protocols and strategies outlined in this Application Note provide a robust framework for overcoming co-elution challenges, ultimately advancing the scientific standardization of herbal medicines with potential applications in drug discovery and development.
In High-Performance Thin-Layer Chromatography (HPTLC) fingerprinting for standardization of bioactive antimicrobial compounds, a significant analytical challenge arises from the detection of naturally occurring compounds that lack chromophores. These compounds do not absorb light in the readily accessible UV-Vis range, rendering them invisible to standard detection methods [1]. This limitation is particularly problematic in antimicrobial research where many bioactive compounds, including certain terpenoids, flavonoids, and phenolic acids, exhibit minimal inherent UV absorption. Derivatization techniques provide a powerful solution to this challenge by chemically modifying target analytes to produce detectable species with distinct spectral properties or visible coloration [70] [71].
The strategic application of derivatization reagents enables researchers to overcome the chromophore limitation and is especially valuable in the analysis of complex plant extracts where antimicrobial compounds coexist with numerous interfering substances [72] [73]. This approach transforms HPTLC from a simple separation technique into a comprehensive analytical platform capable of characterizing the complex chemical profiles of antimicrobial plant extracts.
The Chromophore Detection Challenge in Antimicrobial Analysis
Compounds lacking suitable chromophores present substantial obstacles in HPTLC analysis for antimicrobial standardization. Without appropriate derivatization, these compounds remain undetected despite possessing significant biological activity, leading to incomplete fingerprinting and potential underestimation of a sample's therapeutic potential [71].
The table below summarizes common antimicrobial compound classes and their inherent detection properties:
Table 1: Detection Challenges for Major Antimicrobial Compound Classes
| Compound Class | Examples | Native UV Absorption | Primary Detection Challenge |
|---|---|---|---|
| Terpenoids | Ursolic acid, Oleanolic acid | Weak or none [74] | Lack of chromophore requires derivatization for visualization |
| Flavonoids | Rutin, Quercetin | Moderate to strong [73] | Structural similarities require selective detection |
| Phenolic acids | Gallic acid, Rosmarinic acid | Variable [71] [73] | Concentration may be below detection limit without enhancement |
| Alkaloids | Various plant alkaloids | Weak | Complex matrices interfere with detection |
The fundamental detection challenge extends beyond simple visualization. For accurate standardization, methods must provide sufficient sensitivity, selectivity, and reproducibility to quantify antimicrobial compounds in complex matrices [73]. This requires derivatization protocols specifically optimized for different compound classes commonly encountered in antimicrobial plant research.
Derivatization Solutions and Mechanisms
Derivatization techniques overcome detection limitations by converting non-UV-absorbing compounds into detectable derivatives through specific chemical reactions. These reactions can be categorized based on their mechanism and application timing (pre-chromatography or post-chromatography).
Chemical Derivatization Reagents
Table 2: Derivatization Reagents for Antimicrobial Compound Detection
| Reagent | Target Compound Classes | Mechanism | Detection Method | Visualization Outcome |
|---|---|---|---|---|
| AlCl₃ (Aluminum chloride) | Flavonoids with free OH groups at C-3 and/or C-5 [70] | Acid-stable complex formation with keto group and adjacent hydroxyl | UV-Vis (λmax 370-420 nm) [70] | Bathochromic shift with fluorescence under UV366nm |
| NaNO₂-AlCl₃-NaOH | Flavonoids with vicinal OH groups on B-ring [70] | Formation of flavonoid-nitroxyl chelate | UV-Vis (λmax ~500 nm) [70] | Hyperchromic shift with increased absorbance |
| p-Anisaldehyde-Sulfuric Acid | Terpenoids, phytosterols [71] [74] | Dehydration and formation of conjugated carbonium ions | Visible light after heating | Purple/violet bands for triterpenes and phytosterols [71] |
| Ferric Chloride | Phenolic compounds [71] | Formation of iron-phenol complexes | Visible light | Blue/violet complexes with phenols; green-blue with flavonoids [71] |
| DPPH● | Antioxidants with free radical scavenging activity [71] | Electron donation reduces purple DPPH● to yellow | Visible light | Pale yellow zones against purple background [71] |
| Ninhydrin | Amino acids, amino sugars | Formation of Ruhemann's purple | Visible light after heating | Purple bands for nitrogen-containing compounds |
Reaction Mechanisms
The AlCl₃ derivatization method targets flavonoids through formation of acid-stable complexes between the Al³⁺ cation and the keto group at C-4 with either the C-3 or C-5 hydroxyl group. This complexation produces a bathochromic shift of approximately 30-100 nm, moving the absorption maximum to the more detectable 370-420 nm range [70]. For flavonoids with vicinal hydroxyl groups on the B-ring, the NaNO₂-AlCl₃-NaOH system first oxidizes the ortho-dihydroxy structure using sodium nitrite as an oxidizing and nitrating agent, yielding o-quinones and flavonoid-nitroxyl derivatives. In the basic environment created by NaOH, these derivatives form distinct chelates with Al³⁺ that exhibit a new absorbance maximum at approximately 500 nm [70].
The p-anisaldehyde-sulfuric acid reagent works through a dehydration mechanism followed by formation of conjugated carbonium ions that produce characteristic colorations for different compound classes: blue for monoterpenes, dark purple for triterpenes and phytosterols, and brown spots for diterpenes [71].
Derivatization Solutions Workflow
Experimental Protocols
HPTLC Analysis of Flavonoids with AlCl₃ Derivatization
Objective: To detect and characterize flavonoid compounds in plant extracts using AlCl₃ derivatization for antimicrobial profiling [70].
Materials and Instruments:
- HPTLC plates: Silica gel 60 F₂₅₄ (e.g., Merck, Germany) [13] [73]
- Application device: Automatic applicator (e.g., Camag Linomat IV/V) [13] [73]
- Development chamber: Twin-trough glass chamber (e.g., Camag) [73]
- Derivatization apparatus: Sprayer or immersion device
- Documentation: Densitometer with winCATS software (e.g., Camag TLC Scanner 3) [13] [73]
Reagents:
- Standard flavonoids (e.g., rutin, quercetin, myricetin)
- Aluminum chloride (AlCl₃) solution (2% in methanol) [70]
- Mobile phase: Optimized for flavonoid separation (e.g., toluene:ethyl acetate:formic acid:methanol, 3:4:0.8:0.7 v/v) [73]
Procedure:
- Plate Preparation: Pre-wash HPTLC plates with methanol and activate at 120°C for 20-30 minutes [75].
- Sample Application: Apply samples and standards as bands (4-6 mm width) using automatic applicator. Maintain application rate of 50 nL/s [75].
- Chromatogram Development: Develop plate in mobile phase-saturated chamber to a distance of 80 mm from origin [73].
- Plate Drying: Dry developed plate in fume hood with air dryer [75].
- Derivatization: Uniformly spray plate with 2% AlCl₃ solution until slightly moist [70].
- Detection: Heat plate at 100°C for 3-5 minutes, then document under UV 366 nm and white light [70] [71].
- Densitometric Analysis: Scan plate at 370-420 nm for quantitative analysis [70].
Expected Results: Flavonoids appear as fluorescent zones under UV 366 nm. The complexation produces bathochromic shifts enabling detection and quantification.
Comprehensive Antimicrobial Metabolite Profiling
Objective: To create complete metabolic profiles of plant extracts with antimicrobial activity using multiple derivatization reagents [72] [71].
Materials and Instruments:
- Same HPTLC instrumentation as protocol 4.1
- Derivatization reagents: AlCl₃, p-anisaldehyde-sulfuric acid, ferric chloride, DPPH● [71]
- Mobile phase: n-hexane:ethyl acetate:acetic acid (60:36:4 v/v) [71]
Procedure:
- Plate Development: Follow steps 1-4 from protocol 4.1 using appropriate mobile phase.
- Sequential Derivatization: a. DPPH● Assay: Spray with 0.2% DPPH● in methanol to detect antioxidants as pale yellow zones on purple background [71]. b. Ferric Chloride Detection: Spray with 1% FeCl₃ in ethanol/water to detect phenolics as blue-gray zones [71]. c. p-Anisaldehyde-Sulfuric Acid: Spray with fresh reagent (0.5 mL p-anisaldehyde, 10 mL acetic acid, 85 mL methanol, 5 mL sulfuric acid), heat at 100°C for 5-10 minutes until colors develop [71].
- Documentation: Capture images after each derivatization step under white light, UV 254 nm, and UV 366 nm [71].
- Data Integration: Combine results from all derivatizations to create comprehensive metabolic profile.
Expected Results: Different compound classes visualize with characteristic colors: phenolic compounds (blue with FeCl₃), terpenoids (purple/violet with p-anisaldehyde-H₂SO₄), and antioxidants (yellow with DPPH●).
HPTLC Derivatization Protocol Selection
The Scientist's Toolkit: Essential Research Reagents
Table 3: Essential Reagents for HPTLC Derivatization in Antimicrobial Research
| Reagent/Equipment | Function/Purpose | Application Notes | Safety Considerations |
|---|---|---|---|
| Silica gel 60 F₂₅₄ plates | Stationary phase with fluorescent indicator | Standard for most applications; 0.25 mm thickness for analytical work [75] | Handle edges only to prevent contamination |
| Aluminum chloride (2%) | Flavonoid complexation agent [70] | Detects flavonoids via bathochromic shifts; use fresh solution | Corrosive; use in well-ventilated area |
| p-Anisaldehyde-sulfuric acid reagent | Universal natural product detection [71] | Colors vary by compound class; requires heating | Highly corrosive; prepare fresh with care |
| DPPH● (0.2% in methanol) | Free radical scavenger for antioxidant detection [71] | Identifies compounds with radical scavenging activity | Light-sensitive; store in amber container |
| Ferric chloride (1%) | Phenolic compound detection [71] | Forms colored complexes with phenols | Corrosive; can stain surfaces |
| Automatic TLC applicator | Precise sample application | Essential for quantitative reproducibility; band application preferred [75] | Regular calibration required |
| Twin-trough development chamber | Chromatogram development | Ensures proper vapor saturation for reproducible Rf values [73] | Clean between uses to prevent contamination |
| Densitometer with winCATS software | Quantitative analysis and documentation | Enables scanning at multiple wavelengths and Rf calculation [73] | Regular validation required for quantitative work |
Method Validation and Data Analysis
For standardization of antimicrobial compounds, HPTLC methods must be rigorously validated according to International Conference on Harmonisation (ICH) guidelines [73]. Key validation parameters include:
- Linearity: Calibration curves should demonstrate correlation coefficient r > 0.995 over the analytical range [75]
- Precision: Relative standard deviation (RSD) < 5% for replicate analyses [75]
- Accuracy: Recovery of 95-105% for spiked samples [75]
- Detection limits: LOD < 2.0 ng/band for most applications [75]
Quantitative analysis requires scanning of derivatized plates with a densitometer at the appropriate wavelength for each derivative. For AlCl₃-derivatized flavonoids, scanning at 370-420 nm captures the bathochromically shifted absorption maximum [70]. Data analysis should include Rf calculation and multivariate data analysis techniques such as hierarchical clustering analysis (HCA) and principal component analysis (PCA) for comprehensive metabolic profiling [72].
The integration of derivatization techniques with validated HPTLC methods provides a robust platform for standardizing complex antimicrobial plant extracts, enabling reliable qualification and quantification of both chromophoric and non-chromophoric bioactive compounds.
For researchers focusing on the standardization of bioactive antimicrobial compounds, achieving reproducible results is not merely a best practice but a fundamental necessity. High-performance thin-layer chromatography (HPTLC) has emerged as a powerful analytical technique for establishing the chemical fingerprint of complex natural products, including antimicrobial plant extracts [23]. The technique's robustness, simplicity, and cost-effectiveness make it ideally suited for the analysis of botanicals and herbal drugs [1]. However, the full potential of HPTLC in generating reliable, reproducible data for antimicrobial compound research can only be realized through stringent standardized operating procedures (SOPs) and meticulous environmental controls throughout the analytical process. This document outlines detailed application notes and protocols to ensure such reproducibility, framed within the context of HPTLC fingerprinting for standardizing bioactive antimicrobial compounds.
Standardized Workflow for HPTLC Analysis
A standardized workflow is critical for obtaining reproducible chemical fingerprints, especially when tracking antimicrobial activity through bioautography. The following diagram illustrates the comprehensive, controlled workflow for HPTLC analysis of antimicrobial compounds.
Diagram 1: Standardized HPTLC workflow for antimicrobial compound analysis, highlighting critical control points.
This integrated workflow ensures that each step from sample preparation to final database entry is performed under controlled conditions, with specific attention to steps that interface with antimicrobial activity detection through bioautography.
Detailed Experimental Protocols
Standardized Sample Preparation for Antimicrobial Plant Extracts
Principle: Consistent sample preparation is the foundation for reproducible HPTLC fingerprints. For antimicrobial studies, this step must preserve bioactive compound integrity while removing interfering matrix components.
Materials:
- Plant material (dried, powdered)
- Methanol (HPLC grade)
- Ultrasonic bath
- Volumetric flasks (50 mL)
- Syringe filters (0.45 μm)
Procedure:
- Weigh 100 mg of accurately powdered plant material into a 50 mL volumetric flask.
- Add 40 mL of 50% aqueous methanol and sonicate for 30 minutes at 25°C.
- Cool to room temperature, make up to volume with 50% aqueous methanol, and mix thoroughly.
- Filter through a 0.45 μm syringe filter, discarding the first 2 mL of filtrate.
- Use the clear filtrate for HPTLC application within 24 hours to prevent degradation.
Critical Control Parameters:
- Temperature: Maintain extraction temperature at 25°C ± 2°C
- Time: Standardize sonication time to 30 minutes ± 1 minute
- Solvent Composition: Use consistent 50% aqueous methanol (v/v) across all extractions
- Storage: Keep prepared samples at 4°C if not used immediately
HPTLC Fingerprinting with Two-Step Derivatization
Principle: This protocol adapts established SOPs for HPTLC chemical fingerprinting to specifically target antimicrobial compound classes through a two-step derivatization process capable of detecting a wide range of phytochemicals [23].
Materials and Reagents:
- HPTLC plates: Silica gel 60 F₂₅₄ (10 cm × 10 cm or 20 cm × 10 cm)
- Mobile phase: 1-butanol‒2-propanol‒aqueous boric acid (5 mg/mL) (30:50:10, V/V) [68]
- Derivatization reagent 1: Aniline-diphenylamine (for carbohydrates)
- Derivatization reagent 2: Natural Products reagent (for phenolics)
- Application device: Linomat 5 (CAMAG) or equivalent
- Development chamber: Automated Development Chamber (ADC2)
Procedure:
- Sample Application:
- Condition HPTLC plates at 65°C for 10 minutes before application
- Apply 2-4 μL of standard and sample solutions as 8 mm bands
- Set application position 8.0 mm from bottom and 20.2 mm from side edges
- Maintain application rate at 40 nL/s
Chromatogram Development:
- Condition development chamber to 33% relative humidity for 60 minutes [68]
- Use 10 mL of mobile phase in a twin-trough chamber
- Develop to a migration distance of 85 mm at constant temperature (25°C ± 2°C)
- Dry plates for 5 minutes in a stream of warm air after development
Derivatization and Detection:
- Step 1: Derivatize with aniline-diphenylamine reagent using a yellow nozzle derivatiser
- Heat at 115°C for 10 minutes and document under white light [68]
- Step 2: Derivatize with Natural Products reagent for specific antimicrobial compound classes
- Document under UV light at 366 nm and white light
Critical Control Parameters:
- Chamber Saturation: Standardize to 60 minutes with 33% relative humidity
- Migration Distance: Fix at 85 mm for all runs
- Drying Conditions: Consistent 5-minute drying between steps
- Documentation: Standardize imaging parameters (exposure, light source)
HPTLC-Bioautography for Antimicrobial Activity Detection
Principle: This function-directed screening approach integrates planar separation with biological activity detection, directly linking chemical profiles to antimicrobial efficacy [11].
Materials:
- Test microorganisms (Staphylococcus aureus, Escherichia coli, Candida albicans)
- Mueller Hinton Agar (for bacteria) or Sabouraud Dextrose Agar (for fungi)
- Incubator (37°C for bacteria, 28°C for fungi)
- Sterile safety cabinet
Procedure:
- Develop HPTLC plate following the fingerprinting protocol but do not derivatize
- Dry plate thoroughly under sterile conditions for 30 minutes
- Prepare microbial suspension equivalent to 0.5 McFarland standard
- Overlay the HPTLC plate with molten agar (approximately 15 mL) inoculated with test microorganism
- Incubate at appropriate temperature for 24-48 hours in a humid chamber
- Visualize inhibition zones and correlate with fingerprint regions
- Dip the plate into a tetrazolium salt solution (0.5 mg/mL MTT) to stain living microorganisms
- Clear zones against a colored background indicate antimicrobial activity
Critical Control Parameters:
- Microbial Inoculum: Standardize to 0.5 McFarland standard (1-2×10⁸ CFU/mL for bacteria)
- Agar Thickness: Maintain consistent 1-2 mm overlay
- Incubation Conditions: Control temperature, humidity, and duration precisely
- Sterility: Maintain aseptic technique throughout the procedure
Research Reagent Solutions
The following table details essential materials and reagents required for reproducible HPTLC analysis of antimicrobial compounds.
Table 1: Essential research reagents and materials for HPTLC analysis of antimicrobial compounds
| Item | Specification | Function in Protocol | Critical Quality Controls |
|---|---|---|---|
| HPTLC Plates | Silica gel 60 F₂₅₄, 10x10 cm or 20x10 cm | Stationary phase for compound separation | Batch-to-batch consistency, particle size (5-6 μm), pre-washing requirement [1] |
| Mobile Phase Components | 1-butanol, 2-propanol (HPLC grade), boric acid (ACS grade) | Solvent system for chromatographic separation | Fresh preparation daily, filtered through 0.45 μm membrane, degassed [68] |
| Derivatization Reagents | Aniline, diphenylamine, phosphoric acid, specific antimicrobial detection reagents | Visualization of separated compounds | Freshly prepared, protected from light, standardized application volume (2 mL) [68] |
| Reference Standards | Target antimicrobial compounds (e.g., berberine, gallic acid, quercetin) | Method calibration and compound identification | Purity >95%, stored according to supplier recommendations, certificate of analysis |
| Sample Application Device | Linomat 5 (CAMAG) or equivalent semi-automated applicator | Precise sample deposition | Calibration certification, consistent application rate (40 nL/s), band length (8 mm) [68] |
| Documentation System | TLC Visualiser 2 (CAMAG) with visionCATS software | Image capture and data analysis | Standardized lighting (white, UV 254 nm, UV 366 nm), regular calibration [68] |
Method Validation and Data Analysis
Validation Parameters for Quantitative Analysis
For reproducible quantification of antimicrobial compounds, the following validation parameters must be established following International Council for Harmonisation (ICH) Q2(R1) guidelines [68].
Table 2: Method validation parameters for quantitative HPTLC analysis of antimicrobial compounds
| Validation Parameter | Target Specification | Experimental Protocol | Acceptance Criteria |
|---|---|---|---|
| Linearity | R ≥ 0.999 | Analyze standard solutions at 6 concentration levels (e.g., 100-800 ng/band) | Correlation coefficient ≥ 0.999, residual plot random distribution [68] |
| Precision | RSD ≤ 2% | Repeat analysis 6 times each for intra-day and inter-day | Intra-day RSD ≤ 1.5%, Inter-day RSD ≤ 2.0% |
| Accuracy | Recovery 98-102% | Standard addition method at 3 concentration levels | Mean recovery 98-102%, individual recovery 95-105% [68] |
| Specificity | Baseline resolution | Analyze standard mixture and sample, perform 2D development | Resolution factor ≥ 1.5, no interference from matrix [68] |
| Limit of Detection (LOD) | Signal-to-noise ≥ 3 | Serial dilution of standard until S/N=3 | Documented value for each target compound (e.g., 20 ng/band for trehalulose) [68] |
| Limit of Quantification (LOQ) | Signal-to-noise ≥ 10 | Serial dilution of standard until S/N=10 | Documented value for each target compound (e.g., 60 ng/band for trehalulose) [68] |
| Robustness | RSD ≤ 2% with deliberate variations | Small, deliberate changes in mobile phase composition, development distance, etc. | No significant effect on RF or resolution (RSD ≤ 2%) |
Data Analysis and Fingerprint Interpretation
The data analysis workflow transforms raw chromatographic data into reproducible, database-searchable fingerprints for antimicrobial compound standardization.
Diagram 2: HPTLC data analysis workflow for antimicrobial compound fingerprinting and standardization.
Critical Data Analysis Steps:
- R₅ Calculation: Determine retardation factors for all bands relative to solvent front and reference standards
- Spectral Correlation: Compare in-situ UV-Vis spectra (200-800 nm) of unknown bands with reference standards
- Chemometric Analysis: Apply principal component analysis (PCA) and hierarchical clustering analysis (HCA) to identify pattern differences between samples
- Bioactivity Correlation: Precisely map inhibition zones from bioautography to specific bands in the chemical fingerprint
- Database Entry: Store complete fingerprints with metadata including R₅ values, spectral data, and associated bioactivity
Environmental Controls and Standardization
Critical Environmental Parameters
Reproducible HPTLC analysis requires strict control of environmental parameters throughout the analytical process. The following factors significantly impact separation efficiency and result reproducibility.
Table 3: Environmental control parameters for reproducible HPTLC analysis
| Parameter | Optimal Condition | Impact on Reproducibility | Control Measures |
|---|---|---|---|
| Temperature | 25°C ± 2°C | Affects mobile phase viscosity, solvent evaporation, and development speed | Air-conditioned laboratory, temperature records for each run |
| Relative Humidity | 33% ± 5% | Critical for water adsorption on silica gel, affecting retention and separation | Use of saturated salt solutions in chamber, humidity-controlled laboratory [68] |
| Light Exposure | Protected from direct light | Prevents photodegradation of light-sensitive antimicrobial compounds | Amber vials for standard/sample solutions, dark storage conditions |
| Gas Environment | Normal laboratory atmosphere | Oxidation of sensitive compounds can alter fingerprints | Inert gas blanket for oxygen-sensitive compounds when necessary |
| Vibration | Minimal | Affects mobile phase flow and band symmetry | Vibration-free table, stable mounting of instrumentation |
Equipment Calibration and Maintenance
Regular calibration of HPTLC instrumentation is essential for reproducible quantitative analysis. The following calibration schedule should be implemented:
Sample Applicator (Monthly Calibration):
- Verify application volume accuracy using gravimetric methods
- Check band positioning and alignment
- Confirm reproducibility of application pattern
Development Chamber (Quarterly Verification):
- Verify chamber saturation consistency using test dyes
- Check for solvent volume effects on development distance
- Confirm absence of chamber geometry effects
Detection System (Semi-Annual Calibration):
- Calibrate UV lamp intensity using actinometry
- Verify white light source consistency with standard reflectance tiles
- Confirm spatial resolution with resolution test patterns
The reproducibility of HPTLC fingerprinting for antimicrobial compound standardization depends on implementing comprehensive standardized operating procedures and stringent environmental controls. By adhering to the detailed protocols, validation parameters, and control measures outlined in this document, researchers can generate reliable, comparable data suitable for database building, quality control, and regulatory submissions. The integration of chemical fingerprinting with bioautography provides a powerful function-directed approach for standardizing bioactive antimicrobial compounds, bridging the gap between chemical profiles and biological activity.
The standardization of bioactive antimicrobial compounds in natural products represents a significant challenge in drug discovery and phytochemical research. High-Performance Thin-Layer Chromatography (HPTLC) has emerged as a powerful analytical technique for creating chemical fingerprints of complex natural mixtures, providing a robust platform for separation and preliminary identification [23]. When coupled with multivariate statistical analysis and chemometrics, HPTLC transforms from a simple separation technique into a comprehensive bioanalytical strategy that can efficiently correlate complex chemical profiles with biological activity [76] [58]. This integrated approach is particularly valuable for identifying antimicrobial compounds in situations where traditional bioautography is not feasible due to technical constraints, cost considerations, or the nature of the biological target [76].
The fundamental principle underlying this methodology is the creation of variance in both chemical composition and biological activity across a series of fractions from the same extract. Through fractionation techniques such as Fast Centrifugal Partition Chromatography (FCPC), researchers can generate fractions with fluctuating concentrations of individual compounds [58]. The subsequent correlation of HPTLC chemical profiles with bioactivity data using multivariate statistics allows for the identification of compounds responsible for the observed effects, enabling a function-directed screening approach that prioritizes bioactive constituents for isolation [76] [58].
Experimental Design and Workflow
The comprehensive workflow for bioactive compound identification integrates separation science, biological screening, and multivariate data analysis into a cohesive pipeline. This systematic approach ensures that researchers can efficiently navigate from complex extracts to identified bioactive compounds with validated antimicrobial properties.
Table 1: Key Stages in the Bioactive Compound Identification Workflow
| Stage | Primary Objective | Key Techniques | Output |
|---|---|---|---|
| 1. Sample Preparation | Obtain representative chemical profile | Accelerated Solvent Extraction (ASE) [58] | Crude extract |
| 2. Fractionation | Create chemical and activity variance | FCPC [76] [58] | Series of fractions with varying composition |
| 3. Chemical Profiling | Characterize chemical composition | HPTLC (normal & reverse phase) [76] | Chemical fingerprints |
| 4. Bioactivity Assessment | Quantify biological effects | DPPH assay, Antimicrobial testing [76] [77] | Bioactivity data matrix |
| 5. Multivariate Analysis | Correlate chemistry with bioactivity | OPLS, sHetCA [76] | Identified bioactive compounds |
Figure 1: Integrated workflow for bioactive compound identification combining chemical and biological profiling with multivariate analysis.
Detailed Methodologies and Protocols
HPTLC Fingerprinting Protocol
The standardized HPTLC procedure provides a reproducible method for chemical fingerprinting of natural products, essential for obtaining reliable data for multivariate analysis [23].
Sample Application:
- Use HPTLC silica gel 60 F254 plates (10 × 20 cm)
- Apply samples as 8-mm bands using automated applicator (8 μL/sample)
- Position applications 8 mm from bottom and 15 mm from side edges
- Maintain track distance of 11.5 mm between bands
- Include reference standards on each plate for calibration
Chromatographic Development:
- Develop plates in twin-trough chambers pre-saturated with mobile phase for 20 minutes
- Use development distance of 70 mm from application position
- Employ multiple mobile phase systems for comprehensive profiling:
- Normal phase: ethyl acetate–toluene–formic acid (80:19:1, v/v/v)
- Reverse phase: methanol–water–formic acid (80:19:1, v/v/v)
- Dry plates completely between developments
Derivatization and Detection:
- Implement two-step derivatization for comprehensive phytochemical detection
- First derivatization: Natural Product reagent (1 mL 2-aminoethyl diphenylborate in 200 mL ethyl acetate)
- Second derivatization: Polyethylene glycol 4000 reagent (5 mL in 200 mL dichloromethane)
- Document under UV light at 254 nm, 366 nm, and white light post-derivatization
- Use documentation system with high-resolution CCD camera (25 μm/pixel)
Bioactivity Assessment Methods
DPPH Radical Scavenging Assay (for Antioxidant Activity):
- Prepare 0.2 mM DPPH solution in methanol
- Mix 50 μL of each fraction with 150 μL DPPH solution
- Incubate in dark for 30 minutes at room temperature
- Measure absorbance at 517 nm using microplate reader
- Calculate percentage inhibition = [(Acontrol - Asample)/A_control] × 100
- Express results as IC50 values calculated from dose-response curves [76]
Antimicrobial Susceptibility Testing:
- Employ broth microdilution method for minimum inhibitory concentration (MIC) determination [77]
- Prepare bacterial inoculum at 1×10^6 CFU/mL in Mueller-Hinton broth
- Prepare two-fold serial dilutions of fractions in 96-well microtiter plates
- Add equal volume of bacterial suspension to each well
- Include growth control (inoculum without sample) and sterility control (medium only)
- Incubate at 37°C for 18-24 hours
- Determine MIC as lowest concentration showing no visible growth
- For bioautography, transfer developed HPTLC plates to agar inoculated with test microorganisms [77]
Multivariate Statistical Analysis
The application of chemometrics to HPTLC data enables the correlation of chemical profiles with biological activity, facilitating the identification of bioactive compounds.
Data Preprocessing:
- Convert HPTLC chromatogram images to densitograms using rTLC or DE-TLC software [76]
- Apply baseline correction and normalization to standardize data
- Create data matrix with samples as rows and Rf values/peak intensities as columns
- Handle missing values through mean imputation or replacement with zero [76]
Orthogonal Partial Least Squares (OPLS) Regression:
- OPLS models separate systematic variation in X (chemical data) into predictive and orthogonal components
- Y matrix contains bioactivity data (e.g., DPPH scavenging percentage)
- Evaluate model quality with R2Y (goodness of fit) and Q2Y (goodness of prediction)
- Identify significant variables through Variable Importance in Projection (VIP) scores
- Compounds with VIP >1.0 are considered potentially bioactive [76]
Sparse Heterocovariance Approach (sHetCA):
- sHetCA identifies correlations between chemical features and bioactivity across multiple fractions
- Method successfully identifies bioactive compounds with 85.7% success rate in controlled studies [76]
- Generates covariance maps highlighting chemical features most strongly associated with bioactivity
Table 2: Key Chemometric Methods for Bioactivity Analysis
| Method | Primary Function | Key Parameters | Interpretation Guidelines |
|---|---|---|---|
| OPLS with UV scaling | Correlate chemical profiles with bioactivity | VIP scores, regression coefficients | VIP >1.0 indicates potentially bioactive compounds [76] |
| OPLS with Pareto scaling | Emphasize lower intensity chromatographic signals | MLR coefficients | Identifies minor compounds contributing to activity [76] |
| sHetCA | Detect bioactive substances in complex mixtures | Covariance patterns, correlation strength | 85.7% success rate in controlled studies [76] |
| Principal Component Analysis (PCA) | Explore natural clustering and outliers | Score plots, loading plots | Identifies natural groupings and anomalous samples |
Essential Research Reagents and Materials
A carefully selected set of reagents and materials forms the foundation for successful implementation of these analytical protocols.
Table 3: Essential Research Reagent Solutions for HPTLC-based Bioactivity Screening
| Reagent/Material | Specifications | Functional Role | Application Notes |
|---|---|---|---|
| HPTLC Plates | Silica gel 60 F254, 10×20 cm | Stationary phase for separation | Enable high-resolution fingerprinting [23] |
| Mobile Phase Systems | Multiple solvent combinations | Create separation selectivity | Normal & reverse phase for comprehensive coverage [76] |
| Derivatization Reagents | NP/PEG, sulfuric vanillin | Visualize compound classes | Two-step process detects diverse phytochemicals [23] |
| FCPC Solvent System | Hexane-ethyl acetate-methanol-water | Fractionation of complex extracts | Creates chemical variance for correlation [76] |
| DPPH Reagent | 0.2 mM in methanol | Assess radical scavenging activity | Indicator for antioxidant potential [76] |
| Microbial Media | Mueller-Hinton broth/agar | Support microbial growth | Standardized antimicrobial assessment [77] |
| Reference Standards | Authentic phytochemical compounds | Chromatographic calibration | Essential for compound identification [23] |
Data Analysis and Interpretation
The interpretation of multivariate statistical outputs requires a systematic approach to distinguish true bioactive compounds from non-active constituents in complex natural mixtures.
Interpreting OPLS Results:
- Analyze VIP plots to identify compounds with strong influence on bioactivity
- Examine regression coefficients to determine direction of correlation (positive or negative)
- Validate model with cross-validation ANOVA (CV-ANOVA) with p<0.05 indicating significant model
- Calculate root mean square error of estimation (RMSEE) to assess prediction accuracy [76]
sHetCA Output Interpretation:
- Identify covariance patterns between specific Rf values and bioactivity measurements
- Focus on compounds showing consistent correlation across multiple fractions
- Prioritize compounds with both high covariance and statistical significance [76]
Validation Strategies:
- Confirm identity of putative bioactive compounds by comparison with reference standards
- Validate biological activity through dose-response studies with pure compounds
- Apply false discovery rate correction when analyzing multiple compounds simultaneously
Figure 2: Data analysis workflow from raw HPTLC data to validated bioactive compound identification.
Application Notes and Troubleshooting
Successful implementation of these protocols requires attention to potential challenges and optimization opportunities.
Critical Optimization Parameters:
- Fractionation quality is crucial - FCPC should create sufficient chemical variance across fractions without complete separation [58]
- HPTLC development conditions must be rigorously standardized for reproducibility [23]
- Biological assays should be optimized for linear range and reproducibility before correlation studies
Common Challenges and Solutions:
- Low reproducibility in HPTLC: Implement strict chamber saturation and controlled environmental conditions [23]
- Weak biological activity in fractions: Consider synergistic effects - combine marginally active fractions to detect enhancement
- Complex correlation patterns: Use complementary chemometric approaches (both OPLS and sHetCA) for verification [76]
- Missing compounds in HPTLC profiling: Employ multiple detection methods (UV at different wavelengths, multiple derivatization reagents) [23]
Advanced Applications:
- Combine HPTLC with MS detection for structural identification of bioactive compounds [11]
- Implement machine learning approaches for pattern recognition in complex datasets
- Develop quantitative methods for confirmed bioactive compounds for standardization [23]
This comprehensive protocol provides researchers with a robust framework for identifying antimicrobial compounds in complex natural extracts using HPTLC fingerprinting combined with multivariate statistics. The integrated approach efficiently bridges chemical analysis and biological assessment, accelerating the discovery of bioactive natural products while utilizing accessible analytical platforms.
Validation Protocols and Comparative Assessment of HPTLC Methods
This application note provides a detailed protocol for the validation of High-Performance Thin-Layer Chromatography (HPTLC) methods, focusing on the critical parameters of specificity, precision, accuracy, and robustness. Within the context of standardizing bioactive antimicrobial compounds, robust method validation is paramount to ensure the reliability, reproducibility, and regulatory compliance of analytical data. This document serves as a practical guide for researchers and drug development professionals, offering standardized experimental protocols, acceptance criteria, and visualization of workflows to support quality control in natural product research.
The standardization of herbal drugs and bioactive antimicrobial compounds presents a significant challenge due to the complex nature of plant matrices. Fingerprint analysis has emerged as a powerful technique to assess the quality of herbal drug materials by evaluating the whole chemical profile rather than relying on a single marker compound [78]. High-Performance Thin-Layer Chromatography (HPTLC) is a sophisticated, automated form of planar chromatography that offers high throughput, cost-effectiveness, and the ability to analyze multiple samples simultaneously under identical conditions [79]. This makes it exceptionally suitable for the screening and standardization of antimicrobial plant extracts, where reproducible fingerprint profiles can serve as a criterion for authenticating materials and detecting adulterants.
Method validation is the process of demonstrating that an analytical procedure is suitable for its intended purpose. It provides assurance that the method will consistently yield reliable results that can be appropriately interpreted. For HPTLC methods aimed at quantifying antimicrobial compounds, establishing specificity, precision, accuracy, and robustness is fundamental to generating data that can support pharmacopeial standards, guide product development, and ensure product efficacy and safety.
Core Validation Parameters: Protocols and Applications
Specificity
Definition and Objective: Specificity is the ability of the method to assess unequivocally the analyte of interest in the presence of other components, such as excipients, impurities, degradation products, or co-extractives from the plant matrix [80]. In antimicrobial compound analysis, it confirms that the measured zone (band) belongs solely to the target bioactive molecule and is resolved from other plant metabolites.
Experimental Protocol:
- Preparation of Solutions:
- Standard Solution: Prepare a solution of the purified antimicrobial reference standard.
- Sample Solution: Prepare a solution from the plant extract containing the target antimicrobial compound.
- Placebo/Blank Matrix Solution: Prepare a mock sample using an inert plant matrix or formulation excipients without the active compound.
- Chromatography:
- Apply the standard, sample, and placebo solutions as bands on an HPTLC plate (e.g., silica gel 60 F254).
- Develop the plate in a suitable mobile phase. For example, a mobile phase of acetone/toluene/chloroform (4:3:3, v/v/v) has been used for compounds like caffeine, while chloroform:ethanol (9.8:0.2 v/v) was effective for stigmasterol [81] [82].
- Derivatize if necessary (e.g., with anisaldehyde-sulfuric acid for terpenes) and document under white light, UV 254 nm, and UV 366 nm.
- Data Analysis and Acceptance Criteria:
- The method is specific if the band for the antimicrobial compound in the sample solution has the same Rf value as the standard, and there is no interference from other zones in the sample or the placebo solution at that Rf [83]. Peak purity assessment using a densitometer with spectral overlay can further confirm specificity.
Precision
Definition and Objective: Precision expresses the closeness of agreement between a series of measurements obtained from multiple sampling of the same homogeneous sample under the prescribed conditions. It is typically investigated at three levels: repeatability, intermediate precision, and reproducibility [80].
Experimental Protocol:
- Repeatability (Intra-day Precision):
- Prepare six independent sample solutions from the same homogeneous plant extract at 100% of the test concentration.
- Analyze all samples on the same day, by the same analyst, using the same instrument.
- Calculate the % Relative Standard Deviation (%RSD) of the peak areas/amounts of the antimicrobial compound.
- Intermediate Precision (Inter-day Precision):
- Repeat the repeatability experiment on a different day, with a different analyst, and/or on a different HPTLC instrument.
- Combine the data from both sets and calculate the overall %RSD.
Acceptance Criteria: Precision is a critical indicator of a method's reliability. For analytical procedures, acceptance criteria for precision are often set based on the analyte's concentration level. The table below summarizes typical acceptance criteria for RSD, drawing from validation practices in pharmaceutical analysis and published HPTLC methods [81] [80].
Table 1: Acceptance Criteria for Precision Validation
| Precision Level | Analyte Concentration | Acceptance Criteria (%RSD) | Reference Example |
|---|---|---|---|
| Repeatability | Assay (API, ~100%) | NMT 2.0% | [80] |
| Impurities (Low Level, ~1%) | NMT 5.0% | [80] | |
| Intermediate Precision | Assay (API, ~100%) | NMT 2.0-3.0% (combined data) | [80] |
| Impurities | NMT 5.0-10.0% (depending on level) | [80] | |
| Reported HPTLC Data | Salivary Caffeine | 0.65–2.74% (Inter-day) | [81] |
Accuracy
Definition and Objective: Accuracy, or trueness, measures the closeness of the test results obtained by the method to the true value. It is typically established by determining the recovery of the analyte spiked into the sample matrix, demonstrating that the method can quantify the antimicrobial compound correctly without interference from the matrix [80].
Experimental Protocol (Standard Addition Method):
- Preparation of Samples: Take a fixed, known quantity of the placebo plant extract (where the target compound is absent or known) or a crude extract with a pre-determined baseline level.
- Spiking: Spike this matrix with the reference standard at three different concentration levels (e.g., 80%, 100%, and 120% of the target concentration), with a minimum of three determinations at each level.
- Analysis and Calculation: Analyze the spiked samples and an unspiked sample. Calculate the percentage recovery of the added standard using the formula:
- % Recovery = (Found Concentration - Baseline Concentration) / Spiked Concentration × 100
Acceptance Criteria: The mean recovery at each level should be within the acceptable range, demonstrating that the method is accurate across the specified range.
Table 2: Acceptance Criteria and Representative Data for Accuracy (Recovery)
| Spike Level | Target Recovery (%) | Reported HPTLC Recovery Data (%) |
|---|---|---|
| 80% | 98-102 | 101.06 - 102.50 [81] |
| 100% | 98-102 | 99.21 - 104.37 [81] |
| 120% | 98-102 | 96.63 - 99.43 [81] |
Robustness
Definition and Objective: Robustness is a measure of a method's capacity to remain unaffected by small, deliberate variations in method parameters. It indicates the reliability of a method during normal usage and is essential for establishing system suitability parameters [83].
Experimental Protocol:
- Identification of Factors: Identify critical method parameters that could influence the results, such as:
- Mobile phase composition (± 1-2% for a component)
- Volume of mobile phase
- Chamber saturation time
- Time from application to development
- Time from development to scanning
- Detection wavelength (± 1-2 nm)
- Experimental Design: Use an experimental design (e.g., one-factor-at-a-time) to introduce small variations in these parameters.
- Analysis: Analyze a standard and a sample solution under each varied condition. Monitor the impact on the Rf value, peak shape, and quantification results.
Acceptance Criteria: The method is considered robust if the Rf values remain consistent (e.g., variation within ± 0.02 units) and the quantitative results (assay) are not significantly affected (e.g., %RSD of assay results under varied conditions remains within the precision acceptance criteria) [83].
Experimental Workflow and Reagent Toolkit
HPTLC Method Validation Workflow
The following diagram illustrates the logical sequence and key decision points in the HPTLC method validation process for antimicrobial compound standardization.
The Scientist's Toolkit: Essential Research Reagents and Materials
A successful HPTLC analysis relies on specific reagents and instruments. The following table details the essential components of an HPTLC workflow for validating methods for antimicrobial compounds.
Table 3: Essential Research Reagent Solutions and Materials for HPTLC
| Item | Function/Description | Examples/Notes |
|---|---|---|
| HPTLC Plates | The stationary phase for separation. | Pre-coated silica gel 60 F254 aluminum plates (e.g., E. Merck); layer thickness of 100-250 μm [81] [83]. |
| Mobile Phase | The solvent system that moves through the stationary phase, effecting separation. | Optimized mixture (e.g., Acetone/Toluene/Chloroform, Hexane/Ethyl acetate/Acetic acid); composition is critical for resolution [81] [83]. |
| Reference Standards | Pure compounds used for identification and quantification. | Authentic standards of the target antimicrobial compound (e.g., gymnemagenin, pterostilbine, gallic acid) [60] [82]. |
| Sample Application Device | For precise and reproducible application of samples as bands. | Automated or semi-automatic applicator (e.g., CAMAG Linomat) [79] [83]. |
| Development Chamber | A sealed chamber for the controlled development of the TLC plate. | Twin-trough glass chamber or automated developing chamber (ADC) for saturation and reproducibility [79]. |
| Derivatization Reagent | A chemical spray used to visualize non-UV active compounds. | Reagents like anisaldehyde-sulfuric acid or vanillin-sulfuric acid react with specific functional groups to produce colored zones [60]. |
| Densitometer | A scanner for quantitative measurement of the intensity of the bands in situ. | CAMAG TLC Scanner; measures absorbance or fluorescence at selected wavelengths (e.g., 275 nm for caffeine) [81] [82]. |
| Documentation System | For capturing and archiving chromatographic images. | CAMAG TLC Visualizer under white light, UV 254 nm, and UV 366 nm [83]. |
The rigorous validation of HPTLC methods is a cornerstone of credible research in the standardization of bioactive antimicrobial compounds from natural products. By systematically establishing specificity, precision, accuracy, and robustness, researchers can ensure that their analytical methods are capable of producing reliable and meaningful data. The protocols and criteria outlined in this application note provide a clear framework that aligns with international guidelines (ICH), supporting the development of standardized herbal products with guaranteed quality, efficacy, and safety for further drug development.
Within the broader context of standardizing bioactive antimicrobial compounds, selecting the appropriate analytical technique is a cornerstone of reliable research. High-performance thin-layer chromatography (HPTLC) and high-performance liquid chromatography (HPLC) are two pivotal techniques employed for the separation, identification, and quantification of antimicrobial agents in complex matrices. This application note provides a structured comparison of HPTLC and HPLC, framing them as complementary tools within a quality control workflow that emphasizes HPTLC fingerprinting for the initial standardization of herbal antimicrobials [78]. The protocols and data presented are designed to assist researchers and drug development professionals in making an informed choice based on their specific project requirements, whether for rapid fingerprinting or high-sensitivity quantitative analysis.
Comparative Analysis: HPTLC versus HPLC
The choice between HPTLC and HPLC is governed by the analytical goals. HPTLC is unparalleled in its ability to provide a visual fingerprint of a complex sample, making it ideal for authenticity testing and rapid screening. HPLC, with its superior resolving power and sensitivity, is the method of choice for precise quantification of specific target compounds [78] [84].
Table 1: Technical and Operational Comparison of HPTLC and HPLC
| Feature | HPTLC | HPLC |
|---|---|---|
| Principle | Open-bed, planar chromatography on a stationary phase. | Closed-bed, column chromatography under high pressure. |
| Sample Throughput | High: Multiple samples and standards run on a single plate simultaneously [78]. | Moderate: Sequential injection and analysis of samples. |
| Analysis Speed | Fast: Simultaneous development for all samples on a plate [85]. | Slower: Run time required for each sample individually. |
| Cost per Analysis | Low: Minimal solvent consumption and reusable plates [85]. | High: Higher solvent consumption and column costs. |
| Detection | Densitometry; visual comparison under UV/Vis light; effect-directed assays (bioautography) [78] [59]. | UV/Vis, PDA, Mass Spectrometry (MS). |
| Key Strengths | In-situ profiling, ability to link chemical profile to biological activity via bioautography, minimal sample cleanup [78] [86]. | High sensitivity, superior resolution for complex mixtures, definitive compound identification with MS. |
| Ideal for | Standardization via fingerprinting [78], adulteration detection [78], and bioactivity-guided fractionation [59]. | Precise quantification of target analytes in complex matrices like plasma [87]. |
Table 2: Quantitative Performance Comparison for Antimicrobial Compounds
| Parameter | HPTLC (from cited literature) | HPLC (from cited literature) |
|---|---|---|
| Linear Range (example) | Meloxicam: 0.03–3.00 µg/band [13]Remdesivir: 0.2–5.5 µg/band [85] | Amoxicillin: 1–100 mg/L (≈ 1-100 µg/mL) [87] |
| Limit of Quantification (LOQ) | Remdesivir: 128.8 ng/band [85] | Amoxicillin: 0.5 mg/L (≈ 0.5 µg/mL) [87] |
| Accuracy (% Recovery) | 98.3–101.2% for drugs in spiked plasma [85] | Within ±15% of nominal concentration [87] |
| Precision (Intra-assay) | Not explicitly stated, but methods are validated per ICH guidelines [13] [85]. | ≤15% [87] |
Experimental Protocols
Protocol 1: HPTLC Fingerprinting and Quantification of Antimicrobials from Plant Extracts
This protocol is adapted from studies on Dodonaea angustifolia leaves and flowers [86] and is designed for creating standardized fingerprints and quantifying key antimicrobial compounds like flavonoids.
I. Sample Preparation
- Plant Material Extraction: Reduce dried plant material (e.g., leaves) to a fine powder. Accurately weigh 1.0 g of powder and sonicate with 10 mL of methanol in an ultrasonic bath for 15 minutes. Centrifuge at 5000 rpm for 10 minutes and use the supernatant for analysis [86].
- Standard Solution: Prepare stock solutions of antimicrobial standard compounds (e.g., quercetin, myricetin) at a concentration of 1 mg/mL in methanol.
II. HPTLC Instrumentation and Conditions
- Stationary Phase: HPTLC silica gel 60 F254 plates (20 x 10 cm) [13] [86].
- Sample Application: Apply bands of standard solutions and sample extracts (e.g., 4-10 µL per band) using an automatic applicator (e.g., CAMAG Linomat 5) with a nitrogen flow. The distance from the bottom edge should be 8 mm, and the distance between tracks should be 11.5 mm.
- Chromatographic Development: Develop the plate in a twin-trough glass chamber previously saturated with the mobile phase for 20 minutes. A typical mobile phase for flavonoids is Toluene : Ethyl Acetate : Formic Acid : Methanol (20:12:8:4, v/v/v/v) [86]. Develop the plate to a distance of 80 mm from the application point.
- Derivatization (Optional): For better visualization of certain compound classes, the plate can be dipped into or sprayed with a derivatizing agent (e.g., anisaldehyde-sulfuric acid reagent for terpenes) followed by heating.
- Detection and Documentation: Capture the plate images under UV light at 254 nm and 366 nm using a documentation system. For quantification, perform densitometric scanning at the appropriate wavelength (e.g., 245 nm for flavonoids) with a TLC scanner [86].
III. Data Analysis
- Calculate the retardation factor (Rf) for each band: Rf = (Distance traveled by solute) / (Distance traveled by solvent front).
- For quantification, generate a calibration curve by plotting the peak area of the standard against its concentration. Use this curve to determine the concentration of the target compound in the sample extract.
Protocol 2: HPLC-UV Quantification of Antimicrobials in Biological Matrices
This protocol, based on the analysis of antibiotics in human plasma [87], is optimized for the precise quantification of specific antimicrobial compounds in complex biological samples.
I. Sample Preparation (Plasma)
- Deproteinization: Piper 75 µL of plasma sample into a microcentrifuge tube. Add 225 µL of ice-cold acetonitrile (for amoxicillin) [87] or a mixture of methanol and zinc sulfate (for clindamycin) to precipitate proteins.
- Vortex and Centrifuge: Vortex-mix vigorously for 1 minute and centrifuge at 14,000 rpm for 10 minutes.
- Analysis: Transfer the clear supernatant to an HPLC vial for injection.
II. HPLC Instrumentation and Conditions
- Column: Poroshell 120 EC-C18 (2.7 µm, 2.1 x 100 mm) or equivalent reverse-phase column [87].
- Mobile Phase: (A) 5% Acetonitrile in Phosphate Buffer (pH 3.0), (B) Acetonitrile.
- Gradient Program (Example for amoxicillin [87]):
- 0 min: 0% B
- 3 min: 30% B
- 3.5 min: 30% B
- 4 min: 0% B
- Flow Rate: 0.5 mL/min.
- Column Temperature: 28°C (for amoxicillin) or 40°C (for clindamycin).
- Injection Volume: 5 µL.
- Detection: UV detection at 229 nm for amoxicillin or 204 nm for clindamycin [87].
III. Data Analysis
- Process the chromatograms using the HPLC system's software.
- Construct a calibration curve using standard solutions of known concentration in the same matrix (e.g., drug-free plasma). The curve should have a correlation coefficient (R²) of ≥0.98 [87].
- Quantify the analyte in the sample by interpolating its peak area from the calibration curve.
Workflow Visualization
The following diagram illustrates the decision-making pathway and complementary roles of HPTLC and HPLC in antimicrobial compound analysis.
The Scientist's Toolkit: Essential Research Reagents and Materials
Table 3: Key Reagents and Materials for HPTLC and HPLC Analysis of Antimicrobials
| Item | Function/Application | Example from Literature |
|---|---|---|
| HPTLC Plates (Silica gel 60 F254) | The stationary phase for separation. The F254 indicator fluoresces under 254 nm UV light for band visualization. | Aluminum-backed plates, 20x10 cm [13] [85]. |
| Mobile Phase Solvents | The liquid phase that migrates through the stationary phase, carrying the sample components. Different compositions achieve separation. | Glacial acetic acid:methanol:triethylamine:ethyl acetate [13]; Dichloromethane:acetone [85]. |
| Densitometer Scanner | Instrument for in-situ quantification of the separated bands on the HPTLC plate by measuring the absorbance or fluorescence of the bands. | CAMAG TLC scanner 3 with winCATS software [13] [85]. |
| HPLC Column (C18) | The heart of the HPLC system, containing the reverse-phase packing material where the separation of analytes occurs. | Poroshell 120 EC-C18, 2.7 µm, 2.1 x 100 mm [87]. |
| Analytical Standards | Pure compounds used to create calibration curves for accurate identification and quantification of target antimicrobials in samples. | Florfenicol, Meloxicam [13]; Quercetin, Myricetin [86]; Amoxicillin, Clindamycin [87]. |
Interlaboratory Reproducibility Studies and Collaborative Validation
Within the framework of a broader thesis on HPTLC fingerprinting for standardization of bioactive antimicrobial compounds, establishing interlaboratory reproducibility and conducting collaborative validation are critical final steps. These processes transform a single-laboratory method into an Official Method suitable for regulatory compliance and quality control in drug development [88]. For botanical supplements and antimicrobial plant extracts, whose complex chemical profiles demand robust analytical techniques, High-Performance Thin-Layer Chromatography (HPTLC) offers an efficient, reproducible, and robust platform for chemical fingerprinting [23] [89]. The demand for such validated methods has grown alongside the consumer market for botanical products, prompting government initiatives to increase the availability of standardized protocols [88]. This document outlines the application, protocols, and key considerations for conducting interlaboratory studies to validate HPTLC methods for antimicrobial compound research.
Experimental Design and Validation Parameters
A successful collaborative validation study is built upon a foundation of a Single Laboratory Validation (SLV). The path to official method status begins with an internal validation that confirms the method's ruggedness and fitness for purpose [88]. This SLV must then be systematically tested across multiple independent laboratories.
Key Performance Characteristics for Validation
The performance characteristics evaluated during a collaborative study are the decisive factors in judging a method's suitability. These parameters, summarized in Table 1, provide a quantitative measure of the method's reliability and transferability [88].
Table 1: Key Performance Characteristics for HPTLC Method Validation
| Performance Characteristic | Definition | Acceptance Criteria Example | Quantitative Example from Literature |
|---|---|---|---|
| Linearity & Range | The ability to obtain test results proportional to analyte concentration within a specified range [90]. | Correlation coefficient (r) ≥ 0.990 | Linear range of 1-5 μg per band for bioactive markers [90]. |
| Precision (Repeatability) | Agreement under identical, repeat conditions within a single laboratory [91]. | Relative Standard Deviation (RSD) < 5% | RSD for method precision reported in validation studies [90] [91]. |
| Intermediate Precision (Ruggedness) | Agreement under varying conditions within a single laboratory (e.g., different analysts, days) [88]. | RSD < 5% | Reproducible results across different analysts and equipment [23]. |
| Reproducibility | Agreement between results obtained in different laboratories, as assessed in a collaborative trial [88]. | RSD < 5-10% (compound-dependent) | Demonstrated in collaborative validation studies for official methods [88]. |
| Accuracy | Closeness of agreement between a test result and the accepted reference value [91]. | Recovery of 95-105% | Validated via standard addition and recovery experiments [90]. |
| Limit of Detection (LOD) | The lowest concentration of an analyte that can be detected. | Signal-to-Noise ratio ~3:1 | LOD for fat-soluble vitamins as low as 0.86 ng/band [91]. |
| Limit of Quantification (LOQ) | The lowest concentration of an analyte that can be quantified with acceptable precision and accuracy. | Signal-to-Noise ratio ~10:1 | LOQ for fat-soluble vitamins as low as 2.61 ng/band [91]. |
| Specificity | The ability to assess the analyte unequivocally in the presence of other components. | Clear separation of target compounds in a complex matrix. | Separation of six bioactive compounds in a Siddha drug [90]. |
Core Information for Reproducible HPTLC
To ensure consistency across laboratories, specific sample and method metadata must be standardized and reported. As identified in the search results, four key pieces of information are fundamental [89]:
- Latin Name (Genus and Species): Eliminates confusion from common names and ensures alignment with pharmacopeial standards and reference libraries.
- Plant Part: Directs the analysis to focus on relevant markers, as chemical makeup varies significantly between root, leaf, flower, etc.
- Extraction Solvents and Processing Details: The choice of solvent and extraction process directly determines which compounds are isolated, impacting the final fingerprint. This is crucial for reproducibility.
- Vendor Certificate of Analysis (CoA): Provides secondary confirmation of the sample's origin and composition.
Detailed Protocol for an Interlaboratory Reproducibility Study
The following protocol provides a step-by-step guide for conducting an interlaboratory study to validate an HPTLC method for profiling antimicrobial plant extracts.
Pre-Study Preparation
- Method Finalization: The coordinating laboratory must finalize the HPTLC method based on a complete SLV. A detailed Standard Operating Procedure (SOP) must be drafted, covering every step from sample preparation to data analysis [23].
- Participant Recruitment: Recruit a minimum of 3-8 independent laboratories with demonstrated expertise in HPTLC. The number may vary based on the method's complexity and intended use.
- Sample Homogenization and Distribution: Provide all participating laboratories with identical test samples. This includes:
- Blinded Samples: Homogenized plant material or extract of the same batch.
- Reference Standards: Certified standards of key antimicrobial compounds (e.g., andrographolide, gallic acid, piperine) [90].
- Control Extract: A stable control extract with a known fingerprint to monitor system suitability.
- Method SOP and Data Reporting Sheets: Distribute the comprehensive SOP and standardized sheets for reporting all raw data (Rf values, peak areas, etc.).
Standardized HPTLC Procedure for Antimicrobial Compound Fingerprinting
Materials and Reagents:
- HPTLC Plates: Silica gel 60 F254, 20 x 10 cm (e.g., Merck) [91].
- Sample Applicator: Semi-automated (e.g., CAMAG Linomat 5) [91].
- Development Chamber: Automated Developing Chamber (ADC2) for saturated conditions [91].
- Mobile Phase: Optimized for target antimicrobial compounds. Example: Toluene: Ethyl acetate: Formic acid (7:3:0.5 v/v) for simultaneous estimation of six bioactive compounds [90].
- Derivatization Reagents: Suitable for target compound classes. Example: Vanillin-sulphuric acid reagent for terpenoids [90], or anisaldehyde reagent for lipophilic compounds [30].
- Documentation: TLC Visualiser 2 and densitometer (e.g., TLC Scanner 4) [91].
Step-by-Step Protocol:
Sample Preparation:
- Extract plant material using the specified, standardized method (e.g., ultrasound-assisted extraction with methanol) [86].
- Filter the extract through a 0.45 μm membrane filter.
- Prepare standard solutions in the specified concentration ranges (e.g., 100–300 μg/mL).
Application:
- Pre-wash the HPTLC plates with methanol and activate at 110°C for 20 minutes.
- Apply standard and sample solutions as 8 mm bands, 20 mm from the side edge and 8 mm from the bottom, using an application rate of 30 nL/s [91]. The application volume should be optimized (e.g., 1-5 μL).
Chromatographic Development:
- Condition the ADC2 chamber with the mobile phase for 45 minutes at a relative humidity of 33% [91].
- Develop the plate to a migration distance of 75 mm.
- Dry the plate completely in a fume hood for 5 minutes.
Derivatization and Detection:
- Dip the plate uniformly in the specified derivatization reagent (e.g., vanillin-sulphuric acid).
- Heat the plate at 100°C for 3-5 minutes until bands appear.
- Capture the chromatogram under white light, UV 254 nm, and UV 366 nm using a documentation system.
Densitometric Analysis:
- Scan the plate at the absorbance maximum (λmax) of the target compounds.
- Generate the fingerprint profile and integrate peak areas and Rf values for all key bands.
Data Analysis and Statistical Treatment
- Data Collation: The coordinating laboratory collects all raw data from participants.
- Statistical Evaluation: Calculate the mean, standard deviation (SD), and Relative Standard Deviation (RSD%) for each analyte's Rf value and peak area/height across all laboratories.
- Reproducibility Assessment: The interlaboratory RSD (also called reproducibility standard deviation, sR) is the key metric. Compare the RSD values to pre-defined acceptance criteria (e.g., RSD < 5% for major compounds in a fingerprint) [88].
- Outlier Testing: Apply statistical tests (e.g., Cochran's test, Grubbs' test) to identify and investigate potential outliers in the data set.
Table 2: Example Data from a Collaborative Study of an Antimicrobial Extract
| Analyte / Band | Mean Rf Value | RSD of Rf (%) | Mean Peak Area | RSD of Peak Area (%) | Number of Labs (after outlier removal) |
|---|---|---|---|---|---|
| Gallic Acid | 0.25 | 2.1 | 450 | 4.8 | 8 |
| Unknown Flavonoid 1 | 0.41 | 3.5 | 320 | 7.2 | 8 |
| ρ-Coumaric Acid | 0.58 | 1.9 | 580 | 3.9 | 8 |
| Andrographolide | 0.72 | 2.8 | 210 | 5.5 | 8 |
The Scientist's Toolkit: Essential Research Reagent Solutions
The following table details key materials and reagents essential for achieving reproducible HPTLC results in collaborative studies.
Table 3: Key Research Reagent Solutions for HPTLC Fingerprinting
| Item | Function & Importance in Reproducibility | Example from Literature |
|---|---|---|
| Silica gel 60 F254 HPTLC Plates | Standardized stationary phase; F254 allows for UV visualization. Batch-to-batch consistency is critical. | Used in method development for fat-soluble vitamins and botanical fingerprints [91] [90]. |
| Certified Reference Standards | Essential for calibrating the method, confirming analyte identity (via Rf co-chromatography), and quantifying compounds. | Andrographolide, gallic acid, piperine used for quantification in botanicals [90]. |
| Standardized Derivatization Reagents | Reveals compounds not visible under UV by producing colored or fluorescent derivatives. Reagent preparation and dipping time must be standardized. | Vanillin-sulphuric acid for terpenoids; Diphenylamine for sugars [90] [92]. |
| Validated Mobile Phase | The solvent system responsible for compound separation. Composition and preparation must be precisely defined in the SOP. | Toluene:Ethyl acetate:Formic acid in varying ratios for different compound classes [90] [86]. |
| Automated Application & Development System | Minimizes human error in sample application and chromatographic development, a key factor in interlaboratory reproducibility. | CAMAG Linomat 5 and ADC2 system [91]. |
Workflow and Signaling Pathways
The following diagram illustrates the logical workflow and decision-making process for planning and executing a successful interlaboratory reproducibility study, from method development to final validation.
Figure 1: Interlaboratory Validation Workflow
Interlaboratory reproducibility studies are the cornerstone of collaborative validation, transforming a robust in-house HPTLC method into a universally accepted tool. For the standardization of bioactive antimicrobial compounds from complex plant matrices, this process is non-negotiable. By adhering to structured protocols, reporting essential sample data, and rigorously evaluating defined performance characteristics, the scientific community can build a reliable database of HPTLC fingerprints. This effort, in turn, supports drug development professionals in ensuring the quality, efficacy, and safety of botanical supplements and antimicrobial phytopharmaceuticals, ultimately strengthening the scientific foundation of natural product research.
For researchers and drug development professionals, ensuring the quality of botanical preparations containing bioactive antimicrobial compounds is a significant challenge. These complex mixtures are inherently variable, making batch-to-batch consistency and the detection of adulteration critical for ensuring reproducible efficacy and safety. Chromatographic fingerprinting has emerged as a powerful tool for characterizing these complex systems [93]. This application note details protocols for using High-Performance Thin-Layer Chromatography (HPTLC) fingerprinting within a research framework aimed at standardizing bioactive antimicrobial compounds, focusing on practical methodologies for quality control.
Theoretical Framework: Fingerprinting for Quality Control
Chromatographic fingerprints provide a comprehensive representation of the chemical composition of a botanical drug product or extract. The fundamental principle is that a consistent, therapeutically effective product will produce a highly reproducible fingerprint, whereas significant deviations can indicate quality fluctuations or adulteration [93].
- Batch-to-Batch Consistency: The focus is on monitoring the natural variability inherent in botanical materials. The chemical profile, represented by the fingerprint, should remain within statistically defined limits established from historical batches produced under a standardized manufacturing process [93] [94].
- Detection of Adulteration: This involves identifying deliberate or accidental substitution with inferior material, or the addition of undeclared substances. Adulteration typically introduces new chemical markers or alters the ratios of characteristic compounds, leading to a fingerprint that is categorically different from the authentic reference [95].
While similarity analysis is a common approach, it has limitations, such as over-reliance on a single reference fingerprint and disproportionate weighting of major peaks [93]. This protocol emphasizes the more robust combination of multivariate statistical analysis (MSA) with fingerprinting data for consistency evaluation, and bio-autographic HPTLC for targeting antimicrobial compounds.
Experimental Protocols
Protocol 1: Sample Preparation and HPTLC Fingerprinting
This protocol covers the initial steps of creating a standardized fingerprint.
3.1.1. Sample Extraction
- Principle: Efficiently extract bioactive compounds while maintaining the integrity of the chemical profile.
- Procedure:
- Plant Material: Reduce dried and authenticated plant material to a homogeneous powder using a grinder.
- Solvent Selection: Select an appropriate solvent system (e.g., methanol, ethanol-water mixtures) based on the polarity of the target antimicrobial compounds [26].
- Extraction: Weigh 1.0 g of powdered material and perform solid-liquid extraction with 10 mL of solvent. Sonication for 30 minutes at 40°C is recommended for efficiency [26].
- Filtration: Filter the extract through a 0.45 μm membrane filter prior to HPTLC application.
3.1.2. HPTLC Analysis
- Principle: Separate complex mixtures to create a characteristic fingerprint.
- Procedure:
- Application: Using an automatic applicator (e.g., Linomat 5), apply 5-10 μL of the filtered extract as bands 8 mm wide onto an HPTLC silica gel F₂₅₄ plate.
- Chromatographic Development: Develop the plate in a saturated twin-trough chamber with a mobile phase optimized for the plant material (e.g., Ethyl Acetate: Glacial Acetic Acid: Formic Acid: Water, 100:11:11:26 for many phenolic compounds). Allow the mobile phase to migrate 80 mm from the point of application.
- Derivatization: Derive the plate by uniformly spraying with appropriate reagents (e.g., Anisaldehyde-sulfuric acid for terpenes, Natural Product reagent for flavonoids) followed by heating at 100°C for 3-5 minutes.
- Documentation: Capture the fingerprint under white light (WL), UV 254 nm, and UV 366 nm using a digital documentation system.
Protocol 2: Bio-autographic Assay for Antimicrobial Compound Localization
This protocol is essential for directly linking chemical profiles to antimicrobial activity in a technique known as bio-autography [26].
- Principle: To localize antimicrobial compounds directly on the HPTLC plate after chromatographic separation.
- Procedure (Agar Overlay Method):
- After development, allow the plate to dry thoroughly in a biological safety cabinet for 30-60 minutes to remove all residual solvent.
- Prepare molten nutrient agar (e.g., Mueller-Hinton Agar) and cool to approximately 45°C. Inoculate the agar with a standardized suspension (~10⁶ CFU/mL) of the test microorganism (e.g., Staphylococcus aureus).
- Carefully pour the seeded agar over the HPTLC plate to form an even layer (~2 mm thick).
- Incub the plate in a humid chamber at 37°C for 18-24 hours.
- After incubation, visualize the inhibition zones by spraying with a tetrazolium salt solution (e.g., MTT), which is converted to a purple formazan by living cells, leaving clear zones where microbial growth was inhibited.
- Align the bio-autogram with the original fingerprint to identify the Rf values of compounds responsible for antimicrobial activity.
Protocol 3: Data Acquisition and Multivariate Statistical Analysis for Consistency
This protocol transforms fingerprint data into objective quality control metrics [93] [94].
- Principle: Use statistical models to define normal batch-to-batch variation and detect outliers.
- Procedure:
- Digitization and Data Matrix Creation: Use software (e.g., visionCATS, R) to digitize the HPTLC fingerprints. Create a data matrix (X) where rows represent different production batches (N) and columns represent the peak areas or densities of characteristic peaks (K).
- Data Preprocessing and Weighting: Standardize the data (e.g., unit variance scaling). A critical step is to weight each peak inversely proportional to its batch-to-batch variability. This allows peaks with high natural variability to have a wider acceptable range, while tightly controlling peaks with low variability [93] [94].
- Model Building: Perform Principal Component Analysis (PCA) on the preprocessed data matrix from at least 20-30 historical "good" batches to define the common-cause variation model.
- Statistical Process Control (SPC): Establish control limits for two key statistics:
- Hotelling's T²: Monitors variation within the PCA model (unusual peak area combinations).
- DModX (Distance to Model): Monitors variation outside the PCA model (new or unmodeled variation).
- Quality Evaluation: Test fingerprints from new production batches against the PCA model. Batches whose T² and DModX values fall within the control limits are considered consistent.
Data Presentation and Analysis
Quantitative Data from Fingerprint Analysis
Table 1: Example data matrix for multivariate statistical analysis. Peak areas are normalized to an internal standard.
| Batch ID | Peak 1 (Rf 0.25) | Peak 2 (Rf 0.41) | Peak 3 (Rf 0.58) | ... | Peak K (Rf 0.92) |
|---|---|---|---|---|---|
| B-2101 | 1.45 | 0.87 | 2.31 | ... | 1.02 |
| B-2102 | 1.39 | 0.91 | 2.25 | ... | 0.98 |
| B-2103 | 1.52 | 0.84 | 2.40 | ... | 1.05 |
| ... | ... | ... | ... | ... | ... |
| B-2127 | 1.41 | 0.89 | 2.28 | ... | 1.01 |
Table 2: Key validation parameters for an HPTLC fingerprinting method for botanical identification [64].
| Parameter | Objective | Acceptance Criteria |
|---|---|---|
| Accuracy | Correctly identify plant species and chemical markers | Chromatogram matches reference standard; correct bands present. |
| Precision | Consistent results under the same conditions | Relative Standard Deviation (RSD) of Rf values < 2%. |
| Specificity | Distinguish between closely related species | Unique fingerprint profile distinguishable from adulterants. |
| Robustness | Reliability under small variations in conditions | Method withstands small changes in mobile phase, humidity, etc. |
Visualization of Workflows
Quality Control Evaluation Workflow
The following diagram illustrates the logical workflow for evaluating batch-to-batch consistency using HPTLC fingerprinting and multivariate analysis.
Adulteration Detection Pathway
This diagram outlines the decision-making pathway for detecting adulteration in a sample.
The Scientist's Toolkit: Research Reagent Solutions
Table 3: Essential materials and reagents for HPTLC fingerprinting and bio-autographic assays.
| Item | Function/Application | Examples & Notes |
|---|---|---|
| HPTLC Plates | Stationary phase for chromatographic separation. | Silica gel 60 F₂₅₄ (glass-backed); allows UV visualization at 254 nm. |
| Mobile Phase Solvents | Liquid phase for compound separation. | HPLC-grade solvents (e.g., Ethyl Acetate, Toluene, Methanol, Formic Acid). Composition is critical for resolution. |
| Derivatization Reagents | Visualize separated compounds that are not UV-active. | Anisaldehyde-sulfuric acid, vanillin-sulfuric acid, Natural Product (NP) reagent. |
| Reference Standards | Authenticate plant material and identify key peaks. | Certified bioactive compounds (e.g., berberine, curcumin) or authenticated plant extract. |
| Tetrazolium Salts (MTT/XTT) | Visualize microbial growth inhibition in bio-autography. | MTT (3-(4,5-Dimethylthiazol-2-yl)-2,5-diphenyltetrazolium bromide) is reduced to purple formazan by living cells [26]. |
| Microbial Strains | Test organisms for bio-autographic antimicrobial assay. | Clinical or standard strains (e.g., S. aureus ATCC 25923, E. coli ATCC 25922). |
In the standardization of bioactive antimicrobial compounds, establishing a direct link between a plant's chemical profile and its biological efficacy is a critical challenge. High-Performance Thin-Layer Chromatography (HPTLC) has emerged as a powerful analytical technique that enables the simultaneous chemical fingerprinting and bioactivity profiling of complex plant extracts [96]. This method moves beyond simple quantification by integrating bioautography, allowing researchers to localize and identify specific compounds responsible for observed biological effects directly on the chromatographic plate [96] [2].
The integration of effect-directed analysis (EDA) via HPTLC provides a robust platform for the bioassay-guided assessment of natural products. This approach is particularly valuable for validating the traditional use of medicinal plants and for the preselection of drug candidates based on their bioactivity profiles and pharmacokinetic properties [96] [97]. This Application Note details standardized protocols for correlating HPTLC fingerprints with antimicrobial activity, enabling the establishment of reliable efficacy profiles for natural products.
Theoretical Background and Key Principles
HPTLC Fingerprinting and Bioautography
Chemical fingerprinting using HPTLC provides a visual representation of the complex chemical composition of plant extracts. When this fingerprint is coupled with biological detection methods (bioautography), it becomes a powerful tool for identifying active compounds. In this approach, the developed HPTLC plate is incubated with a microbial strain (e.g., Aliivibrio fischeri or pathogenic bacteria), and zones of inhibition directly reveal the bioactive metabolites [96] [98]. This technique was successfully used to identify green tea and nettle extracts as highly active against E. coli, while calendula flower extract showed significant potency against S. aureus [96].
Chemometric Analysis and Correlation
Advanced chemometric tools are employed to correlate chromatographic data with biological activity. Quantitative Structure-Retention Relationship (QSRR) studies use chromatographic retention (RM0) to predict physicochemical properties relevant to pharmacokinetics (ADME) - absorption, distribution, metabolism, and excretion [97]. Furthermore, Principal Component Analysis (PCA) can classify compounds based on their calculated ADME properties and bioactivity, aiding in the identification of promising drug candidates [97].
Experimental Protocols
Protocol 1: HPTLC Fingerprinting and Antioxidant Profiling of Plant Extracts
This protocol outlines the chemical fingerprinting and in-situ antioxidant activity detection of plant extracts.
- Sample Preparation: Extract 250 g of coarsely powdered plant material (e.g., seeds, leaves) using a suitable solvent like 70% ethanol via hot percolation in a Soxhlet apparatus at 50°C. Concentrate the filtrate using a rotary evaporator and dry the residual extract in a water bath [2] [99].
- HPTLC Analysis:
- Application: Use an automated TLC sampler (e.g., Camag Linomat V) to apply the extract and standards as 8-mm bands on pre-coated silica gel F254 HPTLC plates.
- Development: Develop the plate in a twin-trough chamber previously saturated for 15-30 minutes with a suitable mobile phase. Example phases include:
- Documentation: Capture the plate under UV light at 254 nm and 366 nm for initial visualization [2].
- Derivatization for Antioxidant Detection:
- DPPH• Assay: Spray the developed plate with a 0.2% methanolic DPPH• solution. Active antioxidant compounds appear as yellow zones on a purple background [96] [99].
- Total Phenolic/Flavonoid Content: The Folin-Ciocalteu method (for phenolics) and aluminum chloride method (for flavonoids) can be used for quantification of total content, supporting the bioactivity findings [99] [100].
Protocol 2: HPTLC-Antimicrobial Bioautography Assay
This protocol details the effect-directed analysis for identifying antimicrobial compounds directly on the HPTLC plate.
- Microbial Inoculum Preparation: Grow microbial cultures (e.g., Staphylococcus aureus, Escherichia coli, Candida albicans) in nutrient broth for 24 hours at 37°C to achieve a concentration of approximately 10^8 CFU/mL [2].
- Bioautography:
- Direct Bioautography: After HPTLC development and solvent evaporation, evenly spray the microbial suspension over the plate using an atomizer. Incubate the plate in a humid chamber at 37°C for 18-24 hours [96].
- Agar Overlay Method: Mix the microbial inoculum with molten, cooled soft agar (e.g., Mueller Hinton Agar) and pour it over the HPTLC plate. After solidification, incubate the plate under appropriate conditions [2].
- Viability Detection:
- Tetrazolium Staining: Spray the incubated plate with a solution of MTT (3-(4,5-dimethylthiazol-2-yl)-2,5-diphenyltetrazolium bromide) or resazurin. Living metabolically active microbes reduce the tetrazolium salt to purple formazan. Antimicrobial compounds are visualized as clear zones against a colored background [2].
- Bioluminescence Assay: When using bioluminescent strains like Aliivibrio fischeri, antimicrobial zones are detected as a loss of luminescence, which can be captured and quantified with specialized imaging systems [98].
Protocol 3: Isolation and FTIR Characterization of Bioactive Compounds
This protocol describes the isolation of active compounds from the HPTLC plate for further structural characterization.
- Preparative Isolation: Scale up the HPTLC separation on a preparative TLC plate. After development, briefly expose the plate to UV light to visualize the bands. Scrape off the silica gel corresponding to the bioactive zone, as determined by parallel bioautography [96].
- Compound Elution: Elute the target compound from the silica gel using a high-purity solvent like methanol. Filter the solution to remove silica particles and concentrate it under a stream of nitrogen gas or using a rotary evaporator [96].
- FTIR Spectroscopy: Dissolve the isolated compound in a minimal amount of solvent and analyze it using Fourier-Transform Infrared Spectroscopy (FTIR). The resulting spectrum provides information on functional groups (e.g., amino acids, heterocyclic compounds) present in the bioactive molecule, aiding in its identification [96].
Figure 1: Integrated workflow for correlating HPTLC fingerprints with biological activity, encompassing chemical separation, bioactivity detection, and compound identification.
Data Presentation and Analysis
The Scientist's Toolkit: Essential Research Reagents and Materials
Table 1: Key reagents and materials for HPTLC-efficacy profiling
| Item | Function/Application | Example Use Case |
|---|---|---|
| Pre-coated HPTLC plates (Silica gel 60 F254) | Stationary phase for separation of compounds; F254 allows UV visualization. | Standard matrix for fingerprinting a wide range of plant extracts [2] [13]. |
| Automated HPTLC Applicator (e.g., Camag Linomat) | Precise sample application as narrow bands, crucial for reproducibility. | Essential for standardized application in quantitative and preparative work [23] [2]. |
| DPPH• (2,2-diphenyl-1-picrylhydrazyl) | Free radical reagent for in-situ detection of antioxidant compounds on the plate. | Identification of radical scavengers like those in green tea and walnut leaves [96] [99]. |
| MTT / Resazurin | Viability indicators for microorganisms; reduced to colored formazan (MTT) or fluorescent resorufin (resazurin). | Detection of antimicrobial compounds in bioautography assays [2]. |
| FTIR Spectrometer | Characterization of functional groups in compounds isolated from bioactive HPTLC zones. | Identification of amino acids and heterocyclic compounds in active green tea fractions [96]. |
Representative Experimental Data and Correlation Analysis
The following table compiles quantitative data from studies demonstrating the correlation between HPTLC analysis and bioactivity.
Table 2: Correlation of phytochemical content and bioactive compounds with biological activity in selected medicinal plants
| Plant Material / Extract | Key Bioactive Compounds Identified/Quantified (by HPTLC) | Biological Activity Profile | Correlation Findings |
|---|---|---|---|
| Nymphaea nouchali Seeds (70% ethanol extract) | Catechin (3.06%), Gallic acid (0.27%), Quercetin (0.04%) [2]. | MIC: 0.03 mg/mL for K. pneumoniae, S. dysenteriae, E. coli; 0.31 mg/mL for C. albicans [2]. | High catechin content correlated with strong, broad-spectrum antimicrobial activity. |
| Green Tea Leaf Extract | Catechins (e.g., EGCG), Amino acids, Heterocyclic compounds [96]. | Strong radical scavenging; Active against E. coli; Potent COX-1 inhibition [96]. | Anti-inflammatory activity was attributed not only to catechins but also to amino acids and heterocyclic compounds via FTIR [96]. |
| Barleria prattensis (Methanol extract) | High TPC (72.9 mg GAE/g) and TFC (43.4 mg QE/g) [99]. | DPPH IC50: 16.13 μg/mL (Antioxidant activity) [99]. | High phenolic and flavonoid content directly linked to strong antioxidant capacity. |
| s-Triazine Derivatives | Lipophilicity (RM0) determined by RP-HPTLC [97]. | Predicted ADME properties: BBB penetration, Plasma Protein Binding (PPB) [97]. | Chromatographic retention (RM0) successfully correlated with in-silico pharmacokinetic parameters. |
Discussion and Application
The integrated HPTLC-EDA workflow provides a powerful framework for establishing the efficacy profiles of complex natural extracts. By directly linking chemical fingerprints to biological activity, researchers can move from simply knowing "what is there" to understanding "what is active." This is crucial for the standardization of herbal medicines, as it ensures that products are not only chemically consistent but also biologically potent [96] [23].
The correlation of chromatographic data with in-silico ADME predictions further enhances the drug discovery pipeline. The retention behavior (RM0) of compounds in RP-HPTLC systems serves as a reliable descriptor for lipophilicity, which in turn influences critical pharmacokinetic properties like human intestinal absorption (HIA) and blood-brain barrier (BBB) penetration [97]. This allows for the early preselection of drug candidates with favorable ADME characteristics.
For antimicrobial research, this approach helps identify the specific chemical entities responsible for observed growth inhibition. The discovery that antibacterial activity in certain extracts can be attributed to fatty acids and monoglycerides [96], or that a high concentration of catechin is linked to potent MIC values [2], provides a scientific basis for optimizing antimicrobial formulations from natural sources.
Troubleshooting and Optimization
- Poor Zone Separation in Bioautography: Optimize the mobile phase composition to achieve better resolution of compounds. Using a two-step gradient development can improve the separation of complex mixtures [98].
- Weak or No Antimicrobial Zones: Ensure microbial viability and use a fresh, log-phase culture. The concentration of the inoculum is critical; typically, 10^6 - 10^8 CFU/mL is recommended. Also, consider the solvent used for extraction, as residual solvent on the plate can inhibit microbial growth [2].
- High Background in Viability Staining: Avoid over-incubation after applying the tetrazolium dye. Precise timing is essential to achieve a clear contrast between the purple background and the white inhibition zones [2].
- Irreproducible RF Values: Strictly control chamber saturation conditions, development distance, and temperature. Following a standardized operating procedure (SOP) is paramount for obtaining reproducible fingerprints that can be used for building reliable databases [23].
Conclusion
HPTLC fingerprinting emerges as an indispensable tool for the standardization of bioactive antimicrobial compounds, offering a unique combination of cost-effectiveness, high throughput capability, and direct biological activity assessment through bioautography. The integration of HPTLC with advanced techniques like multivariate statistics, bioautography, and complementary separation methods provides a robust framework for ensuring the quality, safety, and efficacy of herbal antimicrobial products. Future directions should focus on developing comprehensive HPTLC databases for antimicrobial compounds, establishing standardized protocols for HPTLC-bioautography, and exploring hyphenated techniques that combine separation with rapid activity screening. As pharmaceutical research increasingly turns to natural sources for novel antimicrobial agents, HPTLC fingerprinting will play a pivotal role in bridging traditional knowledge with modern quality assurance requirements, ultimately contributing to the development of standardized, evidence-based natural antimicrobial therapies.
References
- 1. High-performance thin layer chromatography: A powerful ... [https://pmc.ncbi.nlm.nih.gov/articles/PMC3658041/]
- 2. In vitro antimicrobial activity and HPTLC analysis of ... [https://pmc.ncbi.nlm.nih.gov/articles/PMC4182785/]
- 3. High performance thin layer chromatography fingerprinting ... [https://www.sciencedirect.com/science/article/abs/pii/S2214786122000109]
- 4. HPTLC Application Notes for Various Analytical Fields [https://camag.com/industries-and-application/application-notes/]
- 5. High-performance thin-layer chromatography [https://en.wikipedia.org/wiki/High-performance_thin-layer_chromatography]
- 6. Targeted HPTLC Profile, Quantification of Flavonoids and ... [https://pmc.ncbi.nlm.nih.gov/articles/PMC10052987/]
- 7. An High Performance Thin Layer Chromatography (HPTLC ... [https://pubmed.ncbi.nlm.nih.gov/40213858/]
- 8. Investigating Flavonoids by HPTLC Analysis Using ... [https://www.mdpi.com/1420-3049/29/21/5161]
- 9. Combining chemometric analysis of HPTLC data and 13 C ... [https://www.sciencedirect.com/science/article/abs/pii/S0021967325006004]
- 10. High-Performance Thin-Layer Chromatography (HPTLC) [https://link.springer.com/book/10.1007/978-3-642-14025-9]
- 11. Versatile Platforms based on HPTLC: Multimodal and ... [https://www.sciencedirect.com/science/article/pii/S0924224425004467?dgcid=rss_sd_all]
- 12. Phytochemical fingerprinting, antioxidant and antibacterial ... [https://pmc.ncbi.nlm.nih.gov/articles/PMC12604242/]
- 13. FDA validated ecofriendly HPTLC method for quantification ... [https://www.nature.com/articles/s41598-025-18548-z]
- 14. HPTLC- and LC-MS-Based Metabolomics and Network ... [https://www.nrfhh.com/HPTLC-and-LC-MS-Based-Metabolomics-and-Network-Pharmacological-Targets-of-Andrographis,204982,0,2.html]
- 15. comparison with the published methods [https://pmc.ncbi.nlm.nih.gov/articles/PMC11705924/]
- 16. The valuable role of high-performance thin-layer ... [https://link.springer.com/article/10.1007/s00764-025-00346-y]
- 17. Application of HPTLC Multiwavelength Imaging and Color ... [https://www.mdpi.com/1420-3049/26/23/7225]
- 18. WHO guidelines for quality control of herbal medicines [https://ijpca.org/archive/volume/11/issue/3/article/22100]
- 19. WHO 2025 Guide: Herbal Product Standardization & ... [https://www.foodresearchlab.com/insights/regulation-updates/who-herbal-labeling-2025/]
- 20. A global comparative analysis of guidelines for herbal ... [https://www.sciencedirect.com/science/article/abs/pii/S1876382024000635]
- 21. Quality control guidelines [https://www.who.int/teams/health-product-and-policy-standards/standards-and-specifications/norms-and-standards-for-pharmaceuticals/guidelines/quality-control]
- 22. A U.S. Pharmacopeia (USP) overview of Pan American ... [https://pmc.ncbi.nlm.nih.gov/articles/PMC11392873/]
- 23. Standardized HPTLC for Reproducible Chemical ... [https://pubmed.ncbi.nlm.nih.gov/39885022/]
- 24. A strategy for quality evaluation of complex herbal ... [https://pmc.ncbi.nlm.nih.gov/articles/PMC10694152/]
- 25. About the Method Collection [https://www.hptlc-association.org/methods/about_the_method_collection.cfm]
- 26. Extraction, Isolation and Characterization of Bioactive ... [https://pmc.ncbi.nlm.nih.gov/articles/PMC3218439/]
- 27. Antioxidant HPTLC-DPPH Fingerprinting of Honeys and ... [https://pmc.ncbi.nlm.nih.gov/articles/PMC7914617/]
- 28. Purification and biological analysis of antimicrobial ... [https://www.nature.com/articles/s41598-023-41296-x]
- 29. HPTLC fingerprinting of Croton gratissimus leaf extract with ... [https://www.sciencedirect.com/science/article/pii/S0254629917312425]
- 30. HPTLC Fingerprinting—Rapid Method for the ... [https://www.mdpi.com/1420-3049/23/7/1811]
- 31. Bioautography-guided HPTLC-MS as a rapid hyphenated ... [https://pubmed.ncbi.nlm.nih.gov/35949064/]
- 32. HPTLC Combined with sHetCA and Multivariate Statistics ... [https://www.mdpi.com/1420-3049/29/24/6027]
- 33. In vitro antimicrobial activity and HPTLC analysis of ... [https://link.springer.com/article/10.1186/1472-6882-14-361]
- 34. Integration of HPTLC with ATR-FTIR, HRMS and ... [https://www.sciencedirect.com/science/article/abs/pii/S0021967325003152]
- 35. Comparative HPTLC study for simultaneous determination of ... [https://bmcchem.biomedcentral.com/articles/10.1186/s13065-023-01025-x]
- 36. Plates High Performance Thin Layer Chromatography [https://www.sigmaaldrich.com/FI/en/technical-documents/technical-article/analytical-chemistry/thin-layer-chromatography/high-performance-thin-layer-chromatography-plates]
- 37. INSTRUMENTATION: AN OVERVIEW | PharmaTutor HPTLC [https://www.pharmatutor.org/articles/high-performance-thin-layer-chromatography-hptlc-instrumentation-overview]
- 38. for Modern Stationary - Phases Thin Layer Chromatography [https://www.chromatographyonline.com/view/stationary-phases-modern-thin-layer-chromatography]
- 39. Development of a Validated High-Performance Thin-Layer ... [https://www.mdpi.com/1420-3049/30/19/3859]
- 40. HPTLC fingerprint profile, in vitro antioxidant and ... [https://pubmed.ncbi.nlm.nih.gov/27939872/]
- 41. Thin-Layer Chromatography Bioautography [https://www.mdpi.com/1420-3049/26/15/4647]
- 42. Antimicrobial Activity of Serbian Propolis Evaluated by Means ... [https://journals.plos.org/plosone/article?id=10.1371/journal.pone.0157097]
- 43. Antibacterial Screening, Biochemometric and ... [https://pmc.ncbi.nlm.nih.gov/articles/PMC9312202/]
- 44. TLC-Bioautography-Guided Isolation and Assessment of ... [https://www.mdpi.com/1420-3049/29/3/717]
- 45. HPTLC-Bioautography-MS-Guided Strategy for the ... [https://pubmed.ncbi.nlm.nih.gov/39805321/]
- 46. Standardization of Unani Drugs with Modern Analytical ... [https://jddtonline.info/index.php/jddt/article/view/3217]
- 47. Standardization and HPTLC Fingerprinting of a Polyherbal ... [https://journal.kci.go.kr/cellmed/archive/articleView?artiId=ART002685387]
- 48. HPTLC and UPLC-MS/MS Methods for Quality Control ... [https://pubmed.ncbi.nlm.nih.gov/31653282/]
- 49. Standardization of a compound Unani herbal formulation ... [https://pmc.ncbi.nlm.nih.gov/articles/PMC3141134/]
- 50. Unani concept of drug substitution (therapeutic interchange ... [https://pmc.ncbi.nlm.nih.gov/articles/PMC7527810/]
- 51. Thin-Layer Chromatography Bioautography [https://pmc.ncbi.nlm.nih.gov/articles/PMC8347725/]
- 52. HPTLC – Bioautographic methods for selective detection of ... [https://pmc.ncbi.nlm.nih.gov/articles/PMC6082773/]
- 53. Phytochemical Profiling, Antioxidant and Antimicrobial ... [https://pmc.ncbi.nlm.nih.gov/articles/PMC11357188/]
- 54. Chemical Fingerprinting and Antioxidant Profiling [https://www.mdpi.com/2223-7747/13/10/1348]
- 55. Phytochemical profiling and evaluation of antioxidant ... [https://www.nature.com/articles/s41598-025-07627-w]
- 56. Bioautography, Synergistic Effect and HPTLC-MS and SEM ... [https://www.ssrn.com/abstract=4210999]
- 57. PLANTA Protocol for the Direct Detection and Identification ... [https://pmc.ncbi.nlm.nih.gov/articles/PMC12529470/]
- 58. Could multivariate statistics exploit HPTLC and NMR data ... [https://www.sciencedirect.com/science/article/abs/pii/S1874390017301386]
- 59. High-performance thin-layer chromatography [https://www.sciencedirect.com/science/article/pii/S0021967322005015]
- 60. High performance thin layer chromatography fingerprinting ... [https://pmc.ncbi.nlm.nih.gov/articles/PMC4784131/]
- 61. A strategy for quality evaluation of complex herbal ... [https://www.sciencedirect.com/science/article/pii/S2405844023093064]
- 62. High-Performance Thin-Layer Chromatography (HPTLC) [https://ctlatesting.com/blogs/articles/high-performance-thin-layer-chromatography-hptlc]
- 63. High Performance Thin Layer Chromatography (HPTLC ... [https://pmc.ncbi.nlm.nih.gov/articles/PMC11357029/]
- 64. Method Validation in High-Performance Thin Layer ... [https://www.eurofinsus.com/food-testing/resources/method-validation-in-hptlc-methods-for-food-and-supplements/]
- 65. High-performance thin layer chromatography: A powerful analytical technique in pharmaceutical drug discovery - PMC [https://www.ncbi.nlm.nih.gov/pmc/articles/PMC3658041/]
- 66. High Performance Thin Layer Chromatography (HPTLC) [https://forensicspedia.com/high-performance-thin-layer-chromatography-hptlc/]
- 67. UPLC-ESI-MS/MS and HPTLC Method for Quantitative ... [https://pmc.ncbi.nlm.nih.gov/articles/PMC5498608/]
- 68. Validation of a high-performance thin-layer ... [https://link.springer.com/article/10.1007/s00764-023-00243-2]
- 69. High-performance thin-layer chromatography and direct ... [https://www.sciencedirect.com/science/article/pii/S0963996921003549]
- 70. Investigating Flavonoids by HPTLC Analysis Using ... [https://pmc.ncbi.nlm.nih.gov/articles/PMC11547264/]
- 71. HPTLC and ATR/FTIR Characterization of Antioxidants in ... [https://www.mdpi.com/1420-3049/26/19/6064]
- 72. HPTLC-Based Chemical Profiling: An Approach to Monitor ... [https://pmc.ncbi.nlm.nih.gov/articles/PMC8002819/]
- 73. Development and validation of High-performance Thin ... [https://pmc.ncbi.nlm.nih.gov/articles/PMC5757330/]
- 74. Antimicrobial Properties Using HPTLC and NMR ... [https://www.longdom.org/open-access/antimicrobial-properties-using-hptlc-and-nmr-spectroscopy-96660.html]
- 75. Complete Guide to Thin Layer Chromatography Sample ... [https://www.organomation.com/complete-guide-to-thin-layer-chromatography-sample-preparation]
- 76. HPTLC Combined with sHetCA and Multivariate Statistics ... [https://pmc.ncbi.nlm.nih.gov/articles/PMC11679881/]
- 77. Methods for screening and evaluation of antimicrobial activity [https://pmc.ncbi.nlm.nih.gov/articles/PMC11097785/]
- 78. Advances in Fingerprint Analysis for Standardization and ... [https://pmc.ncbi.nlm.nih.gov/articles/PMC9201489/]
- 79. Quality by Design in HPTLC: A Review of Method ... [https://www.ijsrtjournal.com/article/Quality-by-Design-in-HPTLC-A-Review-of-Method-Development-Approaches]
- 80. Validation of Stability-Indicating HPLC Methods for ... [https://www.chromatographyonline.com/view/validation-of-stability-indicating-hplc-methods-for-pharmaceuticals-overview-methodologies-and-case-studies]
- 81. Development of a Validated High-Performance Thin-Layer ... [https://pmc.ncbi.nlm.nih.gov/articles/PMC12525945/]
- 82. Development of validated HPTLC method for quantification ... [https://www.sciencedirect.com/science/article/pii/S1878535213003468]
- 83. High-Performance Thin-Layer Chromatography (HPTLC ... [https://www.mdpi.com/2227-9717/10/2/394]
- 84. A comparative review on High-Performance Liquid ... [https://www.semanticscholar.org/paper/d42372bf373ced8b29e9afbc21d218a94f6f2e6b]
- 85. An eco-friendly and cost-effective HPTLC method for ... [https://pmc.ncbi.nlm.nih.gov/articles/PMC11063142/]
- 86. Targeted HPTLC Profile, Quantification of Flavonoids and ... [https://www.mdpi.com/1420-3049/28/6/2870]
- 87. New methods for quantification of amoxicillin and ... [https://pmc.ncbi.nlm.nih.gov/articles/PMC9410666/]
- 88. Current initiatives for the validation of analytical methods ... [https://www.sciencedirect.com/science/article/pii/S0958166913006770]
- 89. Key Components for Ensuring Accurate HPTLC Analysis [https://www.eurofinsus.com/food-testing/resources/key-components-for-ensuring-accurate-hptlc-analysis/]
- 90. Method development and validation for quantification of six ... [https://pubmed.ncbi.nlm.nih.gov/36384045/]
- 91. A Validated High-Performance Thin-Layer ... [https://www.mdpi.com/2076-3417/14/23/11064]
- 92. HPTLC based screening method for the evaluation of α- ... [https://www.nature.com/articles/s41598-025-22736-2]
- 93. Batch-to-Batch Quality Consistency Evaluation of Botanical ... [https://pmc.ncbi.nlm.nih.gov/articles/PMC3665986/]
- 94. A weighting approach for chromatographic fingerprinting to ... [https://pubs.rsc.org/en/content/articlelanding/2014/ay/c3ay41728j]
- 95. Application of high-performance thin layer chromatography ... [https://www.sciencedirect.com/science/article/pii/S2666831924000298]
- 96. Bioassay-Guided Assessment of Antioxidative, Anti- ... [https://pubmed.ncbi.nlm.nih.gov/37959765/]
- 97. RP-HPTLC Retention Data in Correlation with the In-silico ... [https://pmc.ncbi.nlm.nih.gov/articles/PMC4232785/]
- 98. Using the HPTLC-bioluminescence bacteria assay for ... [https://www.sciencedirect.com/science/article/pii/S0045653519311683]
- 99. Comprehensive phytochemical profiling of bioactive ... [https://pmc.ncbi.nlm.nih.gov/articles/PMC12181004/]
- 100. Evaluation of bioactive compounds, phytochemicals profile ... [https://www.sciencedirect.com/science/article/abs/pii/S0963996921001812]