AP-SA02 Phage Cocktail Trial Protocol: Design, Challenges, and Clinical Implications for Staphylococcus aureus Infections
This article provides a comprehensive blueprint for designing and implementing a clinical trial protocol for the AP-SA02 phage cocktail, a novel therapeutic targeting drug-resistant Staphylococcus aureus.
AP-SA02 Phage Cocktail Trial Protocol: Design, Challenges, and Clinical Implications for Staphylococcus aureus Infections
Abstract
This article provides a comprehensive blueprint for designing and implementing a clinical trial protocol for the AP-SA02 phage cocktail, a novel therapeutic targeting drug-resistant Staphylococcus aureus. Tailored for researchers, scientists, and drug development professionals, it covers the foundational science behind phage therapy, detailed methodological frameworks for trial design, strategies for troubleshooting common challenges, and validation through comparative analysis with standard-of-care antibiotics. The content synthesizes current regulatory landscapes, patient recruitment strategies, dosing regimens, efficacy endpoints, and safety monitoring to guide the development of effective bacteriophage-based clinical interventions.
Understanding AP-SA02: From Bacteriophage Biology to Clinical Rationale
The Rising Threat of Drug-Resistant Staphylococcus aureus and the Need for Novel Therapies
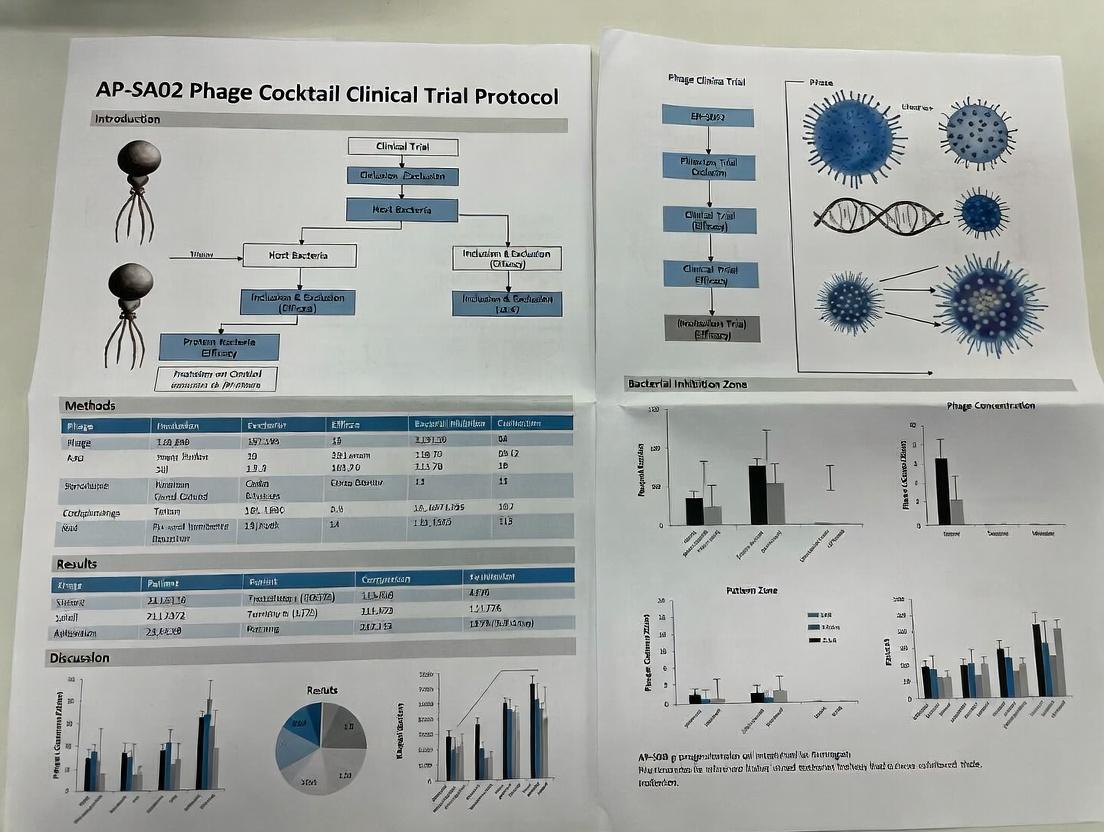
1. Introduction The persistent global health challenge of drug-resistant Staphylococcus aureus, particularly Methicillin-Resistant S. aureus (MRSA), necessitates innovative therapeutic approaches. The AP-SA02 phage cocktail, targeting a broad spectrum of clinically relevant S. aureus strains, represents a promising investigational therapy. This document provides detailed application notes and protocols to support research within the context of the AP-SA02 clinical trial program, facilitating standardized assays for potency, host range determination, and resistance monitoring.
2. Key Quantitative Data on MRSA Burden and AP-SA02 Characteristics
Table 1: Global Burden of Key Drug-Resistant Pathogens (Estimated Annual Deaths)
| Pathogen | Drug Resistance Profile | Estimated Attributable Deaths | Primary Infection Types |
|---|---|---|---|
| Staphylococcus aureus | Methicillin (MRSA) | >100,000 | Bloodstream, surgical site, pneumonia |
| Escherichia coli | 3rd Gen. Cephalosporins | ~50,000 | Bloodstream, UTI |
| Kleptococcus pneumoniae | Carbapenems | ~30,000 | Pneumonia, bloodstream |
| Acinetobacter baumannii | Carbapenems | ~15,000 | Pneumonia, wound |
Table 2: In Vitro Profile of AP-SA02 Phage Cocktail Components
| Phage Component | Genomic Family | Putative Receptor | Lytic Activity Coverage* (% of Clinical Isolates, n=450) |
|---|---|---|---|
| ϕSA012 | Herellviridae | Wall teichoic acid | 89% |
| ϕSA039 | Rountreeviridae | β-N-acetylglucosamine | 78% |
| ϕSA048 | Herellviridae | Unknown | 92% |
| AP-SA02 Cocktail | Combined | Multiple | 98.5% |
*Defined as plaque formation or >3-log reduction in liquid culture.
3. Detailed Experimental Protocols
Protocol 3.1: Phage Cocktail Potency Assay (Plaque-Forming Units - PFU) Purpose: To determine the infectious titer of the AP-SA02 cocktail. Materials: See "The Scientist's Toolkit" (Section 5). Procedure:
- Prepare an overnight culture of the reference S. aureus strain (e.g., ATCC 29213) in Tryptic Soy Broth (TSB).
- Perform ten-fold serial dilutions of the AP-SA02 stock in Phage Buffer.
- Mix 100 µL of bacterial culture with 100 µL of each phage dilution in 3 mL of molten (45°C) Tryptic Soy Agar (TSA) and pour onto a base TSA plate.
- Allow to solidify and incubate at 37°C for 18-24 hours.
- Count plaques on plates containing 30-300 plaques. Calculate PFU/mL using: (Plaque count) x (Dilution Factor) x 10.
Protocol 3.2: Host Range Determination via Spot Assay Purpose: To rapidly screen clinical isolates for susceptibility to AP-SA02. Procedure:
- Streak clinical isolates for single colonies and grow overnight.
- Flood TSA plates with 100 µL of a standardized bacterial suspension (0.5 McFarland).
- Allow surface to dry for 10 min.
- Apply 10 µL spots of the standardized AP-SA02 cocktail (e.g., 1x10^8 PFU/mL) and a negative control (Phage Buffer) onto the bacterial lawn.
- Incubate at 37°C for 24h.
- Interpret results: Clear lysis = susceptible; hazy/partial lysis = intermediate; no lysis = resistant.
Protocol 3.3: Monitoring for Phage Resistance Evolution Purpose: To isolate and characterize bacterial mutants emerging after AP-SA02 exposure. Procedure:
- Co-incubate a susceptible isolate with AP-SA02 at a high MOI (Multiplicity of Infection = 10) in TSB for 24h.
- Plate the culture onto TSA and incubate. Isolate surviving colonies.
- Re-challenge purified colonies with AP-SA02 via spot assay (Protocol 3.2).
- Characterize resistant mutants via:
- Growth Curves: Compare growth kinetics in the presence/absence of phage.
- Genomic DNA Extraction & Sequencing: Identify mutations in putative receptor genes (e.g., tagO, tarM).
4. Visualizations of Key Pathways and Workflows
Diagram 1: Generalized Phage Lytic Cycle
Diagram 2: Isolate Screening & Resistance Workflow
5. The Scientist's Toolkit: Essential Research Reagents
Table 3: Key Reagents for AP-SA02 Research Protocols
| Item | Function/Application | Example Product/Catalog |
|---|---|---|
| Tryptic Soy Broth/Agar | Standard medium for culturing S. aureus. | BD Bacto TSB, TSA |
| Phage Buffer (SM Buffer) | Diluent for phage stock storage and serial dilution. | 50 mM Tris-HCl, 100 mM NaCl, 8 mM MgSO₄, pH 7.5 |
| Agar, Bacteriological Grade | For preparing top and base agar for plaque assays. | Millipore Sigma A5306 |
| DNasel & RNaseA | Treatment of phage lysates to remove contaminating nucleic acids. | Thermo Scientific EN0521, EN0531 |
| 0.22 µm PVDF Filter | Sterile filtration of phage lysates. | Millipore Sigma SLGV033RS |
| Genomic DNA Extraction Kit | For extracting bacterial DNA from phage-resistant mutants for sequencing. | Qiagen DNeasy Blood & Tissue Kit |
| Microbial DNA-Free Water | Critical for PCR and dilution steps to avoid contamination. | Invitrogen 10977015 |
Historical Context and Modern Resurgence
The therapeutic use of bacteriophages (phages) has a cyclical history, marked by early promise, subsequent decline, and a contemporary resurgence driven by the antimicrobial resistance (AMR) crisis.
Table 1: Key Historical Milestones in Phage Therapy
| Era | Year(s) | Event/Significance | Key Figure/Location |
|---|---|---|---|
| Discovery | 1915, 1917 | Independent discovery of bacteriophages. | Frederick Twort (UK), Félix d’Herelle (FR) |
| Early Therapy | 1919-1940s | First human applications; early commercial production. | d’Herelle (global), Eliava Institute (GE) |
| Western Decline | 1940s-1990s | Rise of antibiotics reduces phage R&D in the West. | --- |
| Eastern Continuation | 1940s-Present | Ongoing clinical use and research. | Eliava Institute, Hirszfeld Institute (PL) |
| Modern Revival | 2000s-Present | Phage genomics, synthetic biology, and clinical trials address AMR. | Global academic and biotech centers |
Core Mechanisms of Action
Phages exert their antibacterial effect through two primary life cycles: the lytic cycle and the lysogenic cycle. Only obligately lytic phages are suitable for therapeutic applications.
Title: Lytic vs Lysogenic Phage Life Cycles
Key Enzymatic Activities
Lytic phages encode enzymes critical for bacterial killing:
- Endolysins: Hydrolyze the bacterial peptidoglycan cell wall from within.
- Holins: Form pores in the inner membrane, allowing endolysin access to the wall.
- Depolymerases: Degrade capsular polysaccharides, biofilms, or lipopolysaccharides.
Phage Cocktail Development: AP-SA02 Case Context
AP-SA02 is a refined, fixed-ratio cocktail of three naturally occurring, obligately lytic Staphylococcus aureus phages, developed for treating chronic S. aureus infections. Its design principles are central to modern therapeutic phage development.
Table 2: AP-SA02 Cocktail Composition & Rationale
| Phage Component | Key Genomic Features | Putative Target Receptor | Rationale for Inclusion |
|---|---|---|---|
| SAP-26 | No virulence or AMR genes; encodes tail fiber protein with broad host range | Wall teichoic acid (WTA) | Primary broad-host-range phage. Targets predominant clinical lineages. |
| SAP-34 | Distinct from SAP-26; encodes different tail fiber/ receptor binding proteins | Beta-N-acetylglucosamine (GlcNAc) moieties on WTA | Expands host range through receptor diversity; targets SAP-26 escape mutants. |
| SAP-132 | Encodes a putative polysaccharide depolymerase | Capsular polysaccharide (CP) | Targets encapsulated strains; potential biofilm disruption. |
Title: Therapeutic Phage Cocktail Development Workflow
Experimental Protocols for Phage Characterization
Protocol 4.1: Efficiency of Plating (EOP) Assay
Purpose: Quantify the infectivity of a phage (or cocktail) against a panel of bacterial strains. Reagents:
- Target bacterial strains in mid-log phase (OD600 ~0.4-0.6).
- Purified phage stock, titer known (PFU/mL).
- Soft agar (0.5-0.7% agar in growth medium).
- Bottom agar (1.5% agar in growth medium) plates. Procedure:
- Prepare 10-fold serial dilutions of phage stock in suitable buffer (e.g., SM buffer).
- Mix 100 µL of target bacteria with 3-5 mL melted, cooled (45-50°C) soft agar. Pour over bottom agar plate. Let solidify.
- Spot 5-10 µL of each phage dilution onto the bacterial lawn. Let spots dry.
- Incubate plates (temperature appropriate for host) overnight.
- Count plaques at the appropriate dilution. Calculate EOP: (PFU/mL on test strain) / (PFU/mL on propagation host strain).
Protocol 4.2: Phage Resistance Emergence Frequency
Purpose: Measure the rate of bacterial resistance emergence to a single phage or cocktail. Reagents: As in 4.1, plus a high-titer phage stock (>10^8 PFU/mL). Procedure:
- Spread-plate ~10^8 CFU of the target bacteria onto an agar plate. Let dry.
- Flood plate with a high-titer phage suspension (>10^8 PFU in a small volume) or spot a concentrated cocktail. Incubate overnight.
- Count colonies growing within the zone of lysis (putative phage-resistant mutants).
- Calculate frequency: (Number of resistant colonies) / (Total CFU plated).
The Scientist's Toolkit: Key Reagent Solutions
Table 3: Essential Research Reagents for Phage Therapy R&D
| Reagent / Material | Function & Importance in Phage Research | Example/Notes |
|---|---|---|
| Propagation Host Strains | Well-characterized, susceptible bacteria for high-titer phage stock production. | e.g., S. aureus RN4220 or DSM 20231 for S. aureus phages. |
| Clinical Isolate Panels | Diverse, genetically characterized bacterial strains for evaluating phage host range. | Should include prevalent MLST/types and MDR/XDR strains relevant to the indication. |
| Phage Buffer (SM Buffer) | Stable storage and dilution buffer for phages (contains gelatin for stabilization). | 100 mM NaCl, 8 mM MgSO₄, 50 mM Tris-Cl pH 7.5, 0.01% gelatin. |
| DNase I & RNase A | Used during phage purification to degrade free nucleic acids from lysed bacterial debris. | Critical for obtaining pure phage genomic DNA for sequencing. |
| PEG 8000 (Polyethylene Glycol) | High molecular weight PEG used to precipitate and concentrate phage particles from lysates. | Standard concentration is 10% w/v, followed by CsCl gradient or chloroform extraction. |
| CsCl (Cesium Chloride) | For density gradient ultracentrifugation, yielding ultra-pure phage preparations for genomics or animal studies. | Essential for removing endotoxin/lipopolysaccharide from gram-negative phage preps. |
| Next-Generation Sequencing (NGS) Kits | For complete genome sequencing of phage isolates to confirm lytic nature and absence of AMR/toxin genes. | Illumina MiSeq, Oxford Nanopore, or hybrid approaches for full assembly. |
| qPCR Probes/Primers | For quantifying phage genome copies in pharmacokinetic studies (in vivo) or environmental samples. | Targets a conserved, unique phage gene; requires a standard curve from purified phage DNA. |
1. Introduction and Context This document serves as an application note within the broader thesis research on the clinical trial protocol for the AP-SA02 bacteriophage cocktail. AP-SA02 is an investigational, fixed-composition, phage cocktail targeting Staphylococcus aureus, developed for therapeutic use in critical infections such as ventilator-associated pneumonia. A precise understanding of its composition, host range efficacy, and genomic safety is paramount for protocol design, regulatory submission, and mechanistic interpretation of clinical outcomes.
2. Cocktail Composition & Basic Characterization AP-SA02 is a purified, buffer-formulated cocktail of three naturally occurring, strictly lytic bacteriophages. Current genomic and plaque analysis confirms the following composition.
Table 1: Composition of the AP-SA02 Cocktail
| Phage Component | Genome Size (kb) | Morphotype (Order) | Key Receptor Target | Relative Abundance in Cocktail |
|---|---|---|---|---|
| SA01 | ~143 | Caudoviricetes (Myoviridae) | Wall teichoic acid | ~33% |
| SA02 | ~140 | Caudoviricetes (Podoviridae) | β-N-acetylglucosamine | ~33% |
| SA03 | ~45 | Caudoviricetes (Myoviridae) | Unknown (likely protein) | ~33% |
3. Host Range Determination Protocol 3.1. Objective: To determine the efficacy spectrum (lysis profile) of the AP-SA02 cocktail and its individual components against a diverse panel of clinically relevant S. aureus strains. 3.2. Materials (Research Reagent Solutions):
- Bacterial Panel: >150 clinically derived S. aureus isolates (including MRSA, MSSA, USA300 clones).
- Phage Stocks: Purified, high-titer (≥10⁹ PFU/mL) preparations of AP-SA02 cocktail and individual component phages (SA01, SA02, SA03).
- Soft Agar: Tryptic Soy Broth (TSB) with 0.4% agar.
- Bottom Agar: TSB with 1.5% agar.
- Dilution Buffer: SM Buffer or Phosphate-Buffered Saline (PBS).
3.3. Protocol: Spot Test for Lytic Activity
- Grow each bacterial isolate to mid-log phase (OD₆₀₀ ~0.5) in TSB.
- Mix 100 µL of bacterial culture with 4 mL of melted, cooled (48°C) soft agar and pour over a pre-set bottom agar plate. Allow to solidify.
- Spot 5 µL of each phage preparation (cocktail and components, diluted to ~10⁷ PFU/mL) onto the designated sector of the bacterial lawn.
- Allow spots to dry, invert plates, and incubate at 37°C for 18-24 hours.
- Assess lysis: a clear zone indicates susceptibility; no zone indicates resistance.
3.4. Data Presentation: Table 2: Host Range Analysis of AP-SA02 Against a Clinical S. aureus Panel (n=150)
| Strain Category | # of Strains Tested | % Lysed by Cocktail (AP-SA02) | % Lysed by SA01 only | % Lysed by SA02 only | % Lysed by SA03 only |
|---|---|---|---|---|---|
| All MRSA | 95 | 94.7% | 68.4% | 72.6% | 61.1% |
| All MSSA | 55 | 96.4% | 70.9% | 76.4% | 65.5% |
| USA300 Clone | 42 | 100% | 83.3% | 88.1% | 78.6% |
4. Genomic Safety & Toxin Screening Protocol 4.1. Objective: To bioinformatically and experimentally screen the AP-SA02 component genomes for undesirable genetic elements (e.g., antibiotic resistance genes, virulence factors, lysogeny genes). 4.2. Protocol: In silico Safety Analysis Workflow
- Sequencing & Assembly: Obtain high-coverage (>100x) whole-genome sequences via Illumina/Nanopore. Perform de novo assembly to generate complete, circularized genomes.
- Annotation: Use automated pipelines (e.g., RAST, Prokka) for gene prediction and functional annotation.
- Database Screening: Systematically query annotated genomes against curated databases:
- Resistance: CARD (Comprehensive Antibiotic Resistance Database).
- Virulence: VFDB (Virulence Factor Database).
- Lysogeny: HMMer profiles for integrase, repressor, excisionase genes.
- Toxins: Search for known bacterial toxin homologs (e.g., staphylococcal enterotoxins, Panton-Valentine leukocidin).
- Manual Curation: Manually inspect flagged regions for false positives, gene context, and functionality.
Genomic Safety Screening Workflow
4.3. Safety Verification via PCR
- Design primers targeting regions of interest (e.g., putative integrase gene) identified in silico.
- Perform PCR using phage genomic DNA as template.
- Run products on agarose gel. Sequence any amplicons for confirmation.
- Result: AP-SA02 component genomes showed no hits to resistance or virulence databases. No functional lysogeny genes were identified.
5. Essential Materials Table Table 3: Research Reagent Solutions for AP-SA02 Characterization
| Item | Function / Role in Experiments |
|---|---|
| High-Titer Phage Stocks (>10¹¹ PFU/mL) | Essential for all infectivity, host range, and genomic extraction protocols. |
| Clinical S. aureus Panel | Represents genetic diversity and resistance profiles for realistic host range assessment. |
| Soft Agar Overlay (0.4-0.7%) | Creates a lawn for bacterial growth, allowing visualization of phage plaque formation. |
| SM Buffer / PBS with Mg²⁺ | Stabilizes phage particles during dilution and storage; prevents adsorption to container walls. |
| Next-Gen Sequencing Kits (Illumina) | Enables high-coverage, accurate genome sequencing for safety analysis. |
| Bioinformatics Pipelines (RAST, CARD) | Automated tools for genome annotation and safety screening against databases. |
6. Conclusion for Clinical Protocol Design The data confirm AP-SA02 as a fixed-composition cocktail with broad lytic activity against contemporary S. aureus clinical isolates, including challenging MRSA lineages. Rigorous genomic analysis confirms the absence of safety-concerning genes, supporting its classification as a lytic-only, resistance-free biologic. These application notes provide the essential preclinical characterization framework required for the clinical trial protocol, informing dosage rationale (based on PFU) and patient inclusion criteria (based on likely pathogen susceptibility).
Within the context of developing a robust clinical trial protocol for the bacteriophage cocktail AP-SA02, a thorough review of its preclinical efficacy data is paramount. This document synthesizes key in vitro and in vivo findings, presented as standardized protocols and application notes to guide future correlative studies and support regulatory submissions. AP-SA02 is a fixed phage cocktail targeting Staphylococcus aureus, notably multidrug-resistant strains, and is under investigation for treating acute bacterial skin and skin structure infections.
In vitro studies establish the fundamental antibacterial activity and host range of the AP-SA02 cocktail.
Table 1: Summary of Key In Vitro Efficacy Data for AP-SA02
| Assay Type | Target Strains | Key Metric | Result | Reference/Protocol |
|---|---|---|---|---|
| Plaque Assay | USA300 (MRSA), MSSA strains | Plaque Forming Units (PFU)/mL, Efficiency of Plating (EOP) | >10¹⁰ PFU/mL; Broad EOP >0.1 against >95% of clinical S. aureus isolates (n=150) | Protocol 1.1 |
| Time-Kill Kinetics | USA300 (MRSA) in MH Broth | Log₁₀ CFU/mL reduction over 24h | >3-log reduction at 4h; >6-log reduction at 24h (MOI=10) | Protocol 1.2 |
| Biofilm Eradication | USA300 biofilm on polystyrene | % Biomass reduction (Crystal Violet) | 75-90% reduction after 24h treatment | Protocol 1.3 |
| Antibiotic Synergy Checkerboard | USA300 with Oxacillin, Daptomycin | Fractional Inhibitory Concentration Index (FICI) | FICI ≤0.5 for Daptomycin (synergy) | Protocol 1.4 |
In vivo models demonstrate therapeutic potential and safety in a living system.
Table 2: Summary of Key In Vivo Efficacy Data for AP-SA02
| Model | Animal / Infection | Treatment Regimen | Primary Outcome | Result |
|---|---|---|---|---|
| Neutropenic Thigh | Mouse, MRSA USA300 | Single IM dose, 2h post-infection | Bacterial load in thigh (Log₁₀ CFU/g) | 3.5-log reduction vs. placebo (p<0.001) |
| Skin Abscess | Mouse, MRSA subcutaneous | Topical, BID for 48h | Abscess area & bacterial load | 99% reduction in CFU; significant lesion resolution |
| Systemic Sepsis | Mouse, MRSA IV | Single IV dose, 1h post-infection | 7-day survival rate | 90% survival vs. 10% in control |
| Pharmacokinetics | Rat, Single IV/IM dose | Serial blood sampling | Serum half-life (T₁/₂) | IV: ~0.5h; IM: Cmax at 30 min, detectable for 2h |
Detailed Experimental Protocols
Protocol 1.1: Plaque Assay & Host Range Determination
Objective: To quantify infectious phage particles and determine the susceptibility of clinical S. aureus isolates to AP-SA02. Materials: See "Research Reagent Solutions" table. Procedure:
- Prepare top agar (0.5% agar) in MH broth, maintain at 48°C.
- Mix 100 µL of mid-log phase target bacteria (OD₆₀₀ ~0.4) with 100 µL of serial 10-fold dilutions of AP-SA02 cocktail.
- Incubate mixture at 37°C for 15 min.
- Add 3 mL top agar, vortex, and pour onto pre-set MH agar plates.
- Allow to solidify, invert, and incubate at 37°C for 18-24h.
- Count plaques in the dilutions yielding 20-200 plaques. Calculate PFU/mL.
- For host range, repeat with a panel of clinical isolates. Calculate Efficiency of Plating (EOP) as (PFU on test strain / PFU on propagation host).
Protocol 1.2: Time-Kill Kinetics Assay
Objective: To evaluate the bactericidal activity of AP-SA02 over time. Procedure:
- Inoculate 10 mL MH broth with target S. aureus to ~1x10⁶ CFU/mL.
- Add AP-SA02 cocktail at target MOI (e.g., 0.1, 1, 10). Include a bacteria-only growth control.
- Incubate at 37°C with shaking.
- At timepoints (0, 2, 4, 6, 8, 24h), remove 100 µL aliquots, perform serial dilutions in PBS, and plate on MH agar for CFU enumeration.
- Plot Log₁₀ CFU/mL vs. time to generate kill curves.
Protocol 1.3: Biofilm Eradication Assay
Objective: To assess the ability of AP-SA02 to disrupt pre-formed S. aureus biofilms. Procedure:
- Grow biofilms in 96-well plates using TSB + 1% glucose for 24h at 37°C.
- Gently wash wells with PBS to remove planktonic cells.
- Add AP-SA02 cocktail in fresh medium to wells. Include medium-only control.
- Incubate for 24h at 37°C.
- Wash, fix with methanol, and stain with 0.1% crystal violet for 15 min.
- Wash, solubilize stain with 30% acetic acid, measure OD₅₉₀.
- Calculate % biomass reduction relative to untreated control.
Protocol 2.1: Neutropenic Mouse Thigh Infection Model
Objective: To evaluate in vivo efficacy in a localized infection model. Procedure:
- Render mice neutropenic with cyclophosphamide (150 mg/kg and 100 mg/kg, 4 days and 1 day pre-infection).
- Inoculate both thighs intramuscularly with ~1x10⁶ CFU of MRSA in 50 µL.
- At 2h post-infection, administer AP-SA02 (e.g., 1x10⁹ PFU in 100 µL) or placebo (PBS) via IM route in the contralateral thigh.
- Euthanize mice at 24h post-treatment. Excise thighs, homogenize in PBS, and plate serial dilutions for CFU determination.
Visualizations
Title: AP-SA02 Bacteriophage Lytic Cycle Pathway
Title: In Vivo Efficacy Study Workflow
The Scientist's Toolkit: Research Reagent Solutions
| Item | Function / Relevance | Example / Specification |
|---|---|---|
| AP-SA02 Master Virus Bank | Source of characterized, high-titer phage particles for all experiments. | Titer: >10¹⁰ PFU/mL; Pre-filtered (0.22 µm). |
| S. aureus Strain Panel | Includes reference (USA300) and diverse clinical isolates for host range testing. | MRSA/MSSA; characterized antibiotic resistance profiles. |
| Cation-Adjusted Mueller Hinton Broth/Agar | Standardized medium for antimicrobial susceptibility testing (CLSI guidelines). | Ensures reproducible phage propagation and plating. |
| Cell Dissociation Sieve & Homogenizer | For processing animal tissue (e.g., thigh, skin) to homogeneous suspension for CFU plating. | 70 µm mesh; handheld pestle for microtubes. |
| Crystal Violet Solution (0.1%) | Stain for quantifying adherent biofilm biomass in eradication assays. | Aqueous solution, filtered. |
| Cyclophosphamide | Immunosuppressant to induce neutropenia in the murine thigh infection model. | Reconstituted in sterile PBS, dosed per kg. |
| Automated Colony Counter | For accurate and high-throughput enumeration of bacterial CFU and phage plaques. | Integrated with image analysis software. |
Navigating the Regulatory Pathway for Phage Therapy Clinical Trials
This document provides Application Notes and Protocols for navigating the regulatory pathway for bacteriophage (phage) therapy clinical trials, framed within the context of the AP-SA02 phage cocktail clinical trial protocol research. AP-SA02 is a novel, fixed-ratio cocktail of three naturally occurring, obligately lytic bacteriophages targeting Staphylococcus aureus. The development pathway for such biologic investigational products involves unique considerations distinct from traditional small-molecule drugs.
Regulatory Landscape: Definitions & Pathways
Phage therapies are regulated as biologic products. In the United States, the primary pathway is through the FDA’s Investigational New Drug (IND) application. In the European Union, the Clinical Trial Application (CTA) under the Clinical Trial Regulation (EU) No 536/2014 is required. The table below summarizes key regulatory designations applicable to phage therapy trials for antimicrobial-resistant infections.
Table 1: Key Regulatory Pathways & Designations for Phage Therapy Trials
| Designation/Pathway | Agency | Purpose & Criteria | Relevance to Phage Therapy (e.g., AP-SA02 for S. aureus) |
|---|---|---|---|
| Investigational New Drug (IND) | FDA (US) | To request permission to ship and administer an investigational drug across state lines. Requires submission of animal pharmacology/toxicology, manufacturing, and clinical protocols. | Mandatory for any US-based clinical trial. Phage cocktails require detailed characterization of each component and the final product. |
| Fast Track Designation | FDA (US) | Intended for serious conditions and unmet medical need. Allows for more frequent communication with FDA. | Applicable for phage targeting multidrug-resistant (MDR) infections with limited treatment options. |
| Breakthrough Therapy | FDA (US) | Preliminary clinical evidence indicates substantial improvement over available therapy on a clinically significant endpoint. | Potentially applicable if early phase data shows superior efficacy vs. standard of care for MDR infections. |
| Priority Medicines (PRIME) | EMA (EU) | Enhanced support for medicines targeting unmet medical need. Based on early clinical data. | Similar to Breakthrough Therapy, can accelerate development of phage products for resistant pathogens. |
| Adaptive Clinical Trial Design | FDA/EMA | Allows pre-planned modifications to trial design based on interim data (e.g., sample size, patient population). | Highly relevant for novel phage therapies where dose-response and patient stratification may evolve. |
Pre-Clinical Protocol: Essential Elements for IND/CTA
A robust pre-clinical package is critical for regulatory approval to proceed to First-in-Human (FIH) trials.
Protocol 3.1: In Vitro Host Range & Efficacy Determination
- Objective: To determine the lytic spectrum of the phage cocktail against a panel of clinically relevant bacterial strains.
- Materials: AP-SA02 cocktail (purified, >10^9 PFU/mL), panel of ≥100 genetically characterized S. aureus clinical isolates (including MRSA, MSSA), soft agar, culture media, multi-well plates.
- Method:
- Prepare log-phase bacterial cultures (OD600 ~0.3).
- For spot testing, mix 100 µL bacteria with 4 mL soft agar, pour onto base agar plate.
- Spot 10 µL of serial dilutions (10^0 to 10^-8) of each monophage and the cocktail onto the bacterial lawn.
- Incubate overnight at 37°C.
- Record Plaque Forming Units (PFU)/mL and plaque morphology. Calculate Efficiency of Plating (EOP).
- For planktonic killing assays in broth, use a defined MOI (e.g., 0.1, 1, 10) in a microtiter plate and measure OD600 or CFU/mL over 24h.
- Data Presentation: Tabulate host range as percentage of strains lysed. Generate killing curve graphs.
Protocol 3.2: In Vivo Efficacy & Toxicology in a Relevant Animal Model
- Objective: To demonstrate proof-of-concept efficacy and assess acute toxicity in an animal model of infection.
- Model: Murine neutropenic thigh infection or lung infection model with a S. aureus strain susceptible to AP-SA02.
- Materials: Immunocompromised mice (e.g., cyclophosphamide-treated), bacterial inoculum, AP-SA02 cocktail (filter-sterilized), vehicle control, analytical scale for organ weighing.
- Method:
- Induce neutropenia in mice.
- Inoculate thigh muscle or lungs with a defined CFU of S. aureus.
- At a defined post-infection time (e.g., 2h), administer a single intravenous bolus of AP-SA02 at varying doses (e.g., 10^7, 10^9, 10^11 PFU/kg) or vehicle.
- Euthanize cohorts at 24h post-treatment.
- Harvest and homogenize target organs. Quantify bacterial burden (log10 CFU/g).
- Collect blood for cytokine analysis (IL-6, TNF-α) and clinical chemistry. Perform full necropsy and histopathology on key organs.
- Data Presentation: Compare mean log10 CFU/g between treatment and control groups (statistical analysis). Tabulate serum cytokine levels and histopathology findings.
Clinical Trial Protocol Considerations: Phase 1b/2a
The initial clinical trial for AP-SA02 should be designed as a Phase 1b/2a, randomized, double-blind, placebo-controlled, single-ascending-dose (SAD) and multiple-ascending-dose (MAD) study in patients with complicated S. aureus bacteremia.
Table 2: Key Elements of a Phage Therapy Clinical Trial Protocol (AP-SA02 Example)
| Section | Critical Considerations for Phage Therapy |
|---|---|
| Study Population | Adults with confirmed, refractory S. aureus bacteremia (with or without source infection). Key inclusion: isolate susceptible to AP-SA02 in vitro. Key exclusion: high anti-phage antibody titers. |
| Dose Escalation | SAD: Start with predicted sub-therapeutic dose based on animal PK/PD (e.g., 10^8 PFU/kg). MAD: 3-7 days of dosing based on preclinical PK. Use a sentinel dosing scheme. |
| Endpoints (Primary) | Safety & Tolerability: Incidence of Adverse Events (AEs), Serious AEs (SAEs), changes in clinical labs, vital signs, immunogenicity (anti-phage IgM/IgG). |
| Endpoints (Secondary) | Pharmacokinetics: Serum phage titers (qPCR/plaque assay) over time. Microbiological: Change in bacterial load in blood (qPCR/CFU). Clinical: Resolution of bacteremia, survival. |
| Concomitant Antibiotics | Protocol must define if phage is given as monotherapy or adjunct to "best available" antibiotic therapy. This impacts endpoint interpretation. |
| Immunogenicity Assessment | Serial serum samples (Day 1, 7, 14, 28) to measure neutralizing antibody response against cocktail components. |
| Stopping Rules | Based on pre-defined safety thresholds (e.g., cytokine storm, renal toxicity) or immunogenicity (e.g., rapid neutralization in all subjects of a cohort). |
Protocol 4.1: Monitoring Phage Pharmacokinetics & Bacterial Load in Patient Serum
- Objective: To quantify circulating phage and bacterial DNA levels in patient blood samples.
- Materials: Patient serum samples, DNA extraction kit, qPCR system, primers/probes specific for each AP-SA02 phage genome and S. aureus nuc or femB gene, equipment for plaque assays.
- Method (qPCR for Phage DNA):
- Extract total DNA from 200 µL serum using a commercial kit.
- Perform multiplex qPCR assay with TaqMan probes for each phage.
- Use standard curves (from phage stocks of known PFU titer) to convert Ct values to genomic equivalents (GE)/mL. Correlate with plaque assay data from a subset of samples.
- Method (qPCR for Bacterial Load):
- Use same extracted DNA.
- Perform qPCR for S. aureus-specific gene.
- Convert Ct values to estimated CFU/mL using a standard curve from known bacterial cultures.
- Data Presentation: Generate individual patient PK profiles (GE/mL vs. time) and plot bacterial load dynamics.
The Scientist's Toolkit: Research Reagent Solutions
Table 3: Essential Reagents & Materials for Phage Therapy Development
| Item | Function & Explanation |
|---|---|
| Plaque Assay Materials (Soft Agar, Host Bacterial Strain) | The gold standard for quantifying viable, lytic phage particles (PFU/mL). Essential for titering GMP batches and PK samples. |
| qPCR Primers/Probes for Phage Genomes | Enables rapid, specific quantification of phage genomic particles in complex biological samples (serum, tissue), crucial for PK studies. |
| Anti-Phage Antibody ELISA Kit | Measures host humoral immune response (IgG/IgM) against phage virions. Critical for assessing immunogenicity, a key safety concern. |
| Synthetic Human Serum | Used in in vitro susceptibility testing to model protein-binding effects on phage activity, providing more clinically relevant MIC/EOP data. |
| Genomic Sequencing Services | For complete characterization of Master Cell Bank and production batches, ensuring genetic stability and absence of temperate or toxin genes. |
| Animal Model of Infection (e.g., neutropenic mouse) | Provides critical in vivo proof-of-concept efficacy and preliminary toxicity data required for regulatory approval of FIH trials. |
| cGMP Manufacturing Services | Specialized facilities for the production of high-purity, endotoxin-low, well-characterized phage cocktails under current Good Manufacturing Practices. |
Visualized Workflows & Pathways
Title: Phage Therapy Clinical Development Pathway
Title: Phase 1b/2a Phage Trial Patient Flow
Title: GMP Manufacturing Workflow for Phage Cocktail
Blueprint for Trial Design: Crafting the AP-SA02 Clinical Protocol
The clinical development of the AP-SA02 phage cocktail, targeting Staphylococcus aureus infections, requires precise definition of the target patient population. This protocol, part of a broader thesis on AP-SA02 clinical trial design, details the inclusion and exclusion criteria framework. This ensures patient safety, data homogeneity, and the ability to demonstrate therapeutic efficacy against specific, high-burden S. aureus infections.
Table 1: Epidemiology & Burden of Key S. aureus Infection Types
| Infection Type | Approx. Annual Incidence (US) | Mortality Rate (%) | Common Complicating Factors | Reference (Year) |
|---|---|---|---|---|
| Bacteremia & Infective Endocarditis | ~150,000-200,000 cases | 20-30% (bacteremia), >25% (IE) | Persistent bacteremia, metastatic foci, prosthetic valves | (van Hal et al., 2023) |
| Complicated Skin & Soft Tissue Infections (cSSTI) | >3 million outpatient visits | <1-2% (cSSTI specific) | Deep tissue involvement, surgical site, systemic signs | (Stevens et al., 2022) |
| Prosthetic Joint Infection (PJI) | ~2% of all joint arthroplasties | 5-15% (infection-related) | Biofilm formation, implant retention vs. removal | (Tande et al., 2022) |
| Ventilator-Associated Pneumonia (VAP) | ~10% of mechanically ventilated patients | 20-40% | Multidrug-resistant (MDR) isolates, prolonged ICU stay | (Jones et al., 2023) |
Table 2: Common Phenotypic & Genotypic Resistance Patterns in S. aureus
| Resistance Phenotype | Key Genetic Determinants | Prevalence in Hospital-Associated Infections (US, %) | First-Line Therapeutic Challenges |
|---|---|---|---|
| Methicillin-Resistance (MRSA) | mecA, mecC (SCCmec) | ~45% | Beta-lactam inefficacy, reliance on glycopeptides, lipopeptides |
| Vancomycin-Intermediate Resistance (VISA) | Multiple (e.g., walKR, graSR mutations) | ~3-5% | Reduced glycopeptide susceptibility, treatment failure |
| Daptomycin Non-Susceptibility | mprF, yycG mutations | ~1-3% (rising) | Last-line agent compromise, often co-occurring with VISA |
| Inducible Clindamycin Resistance | erm genes (ermA, ermC) | ~20-30% of erythromycin-resistant isolates | "D-zone test" required to avoid therapeutic failure |
Proposed Inclusion/Exclusion Criteria for AP-SA02 Phase II Trial
Core Inclusion Criteria:
- Age ≥ 18 years.
- Microbiologically confirmed, monomicrobial S. aureus infection from a sterile site or deep wound culture.
- Infection type limited to one of the following:
- Complicated bacteremia (including right-sided infective endocarditis).
- Complicated Skin and Soft Tissue Infection (cSSTI) with systemic inflammatory response.
- Chronic biofilm-associated infection (e.g., prosthetic joint infection) where the hardware is explanted.
- Isolate demonstrates phenotypic resistance or patient intolerance to ≥2 first-line standard-of-care antibiotics.
- Written informed consent.
Core Exclusion Criteria:
- Polymicrobial infection with non-S. aureus pathogens requiring additional non-protocol antibiotics.
- Left-sided infective endocarditis, necrotizing pneumonia, or intracranial infection at baseline.
- Severe neutropenia (ANC < 500 cells/µL) or profound immunosuppression (e.g., post-solid organ transplant on high-dose immunosuppressants).
- Significant hepatic impairment (Child-Pugh Class C).
- Pregnancy or lactation.
- Known hypersensitivity to bacteriophage components.
Experimental Protocol: S. aureus Isolate Characterization for Trial Screening
Objective: To confirm S. aureus species, determine antibiotic susceptibility profile, and assess baseline lysis by AP-SA02 cocktail.
Materials & Workflow:
The Scientist's Toolkit: Research Reagent Solutions
Table 3: Key Reagents for Isolate Characterization
| Item | Function/Application in Protocol | Example Product/Catalog |
|---|---|---|
| Chromogenic S. aureus Agar | Selective and differential isolation; S. aureus colonies appear pink/mauve. | CHROMagar Staph aureus, BD BBL CHROMagar |
| Cation-Adjusted Mueller-Hinton Broth (CA-MHB) | Standardized medium for antibiotic susceptibility testing (AST). | Hardy Diagnostics CA-MHB, BD BBL Sensi-Disc MHB |
| EUCAST/CLSI AST Breakpoint Panels | Pre-configured microtiter plates for determining MICs against a panel of antibiotics. | Sensititre Gram-Positive MIC Plate, VITEK 2 AST-GP Card |
| Phage Buffer (SM Buffer) | Storage and dilution buffer for phage cocktails to maintain stability. | 100 mM NaCl, 8 mM MgSO₄, 50 mM Tris-HCl (pH 7.5), 0.01% gelatin. |
| Soft Agar (Overlay Agar) | Semi-solid medium used in spot assays to facilitate phage diffusion and plaque formation. | Tryptic Soy Broth with 0.4-0.7% Agar. |
| MALDI-TOF MS Target Plate | Steel plate for depositing bacterial isolates for mass spectrometry-based identification. | Bruker MSP 96 target plate. |
Detailed Protocol Steps:
4.1. Isolation and Identification:
- Subculture positive clinical samples onto CHROMagar Staph aureus. Incubate at 35±2°C for 18-24 hours.
- Pick presumptive S. aureus colonies. Perform confirmatory identification using MALDI-TOF MS according to manufacturer's protocol.
- Alternative: Perform PCR targeting the thermostable nuclease (nuc) gene. Use primers: Forward 5'-GCGATTGATGGTGATACGGTT-3', Reverse 5'-AGCCAAGCCTTGACGAACTAAAGC-3'. A 270-bp product confirms S. aureus.
4.2. Antibiotic Susceptibility Testing (AST):
- Prepare a 0.5 McFarland standard suspension of the confirmed isolate in sterile saline.
- For broth microdilution, dilute the suspension in CA-MHB to a final inoculum of ~5 x 10⁵ CFU/mL in a 96-well plate containing serial dilutions of antibiotics (e.g., oxacillin, vancomycin, daptomycin, linezolid).
- Incubate at 35°C for 16-20 hours. Determine the Minimum Inhibitory Concentration (MIC) as the lowest concentration that inhibits visible growth.
- Interpret MIC values according to the most current CLSI M100 or EUCAST breakpoint tables.
4.3. AP-SA02 Lytic Activity Assessment (Spot Assay):
- Grow the S. aureus isolate to mid-log phase (OD₆₀₀ ~0.4-0.6) in Tryptic Soy Broth (TSB).
- Mix 100 µL of bacterial culture with 3 mL of molten soft agar (0.5% agar in TSB, cooled to 45-50°C) and pour over a Tryptic Soy Agar (TSA) plate. Let solidify.
- Spot 10 µL of the AP-SA02 phage cocktail (titer ~10⁹ PFU/mL) and individual component phages onto the dried overlay.
- Allow spots to absorb, invert, and incubate at 37°C for 18-24 hours.
- Record the presence and degree of clearing (confluent lysis vs. discrete plaques) at the spot sites.
Signaling Pathway: Host Immune Response to S. aureus Phage Therapy
This document details the application notes and protocols for the clinical trial structure of AP-SA02, a phage cocktail targeting Staphylococcus aureus. The framework supports the broader thesis research on the AP-SA02 clinical trial protocol, transitioning from initial safety assessment to comprehensive efficacy evaluation.
Trial Phase Structure and Quantitative Benchmarks
Clinical development of a novel biologic like AP-SA02 follows a regulated, phased structure. The table below summarizes the core objectives, design elements, and quantitative benchmarks for each phase.
Table 1: Clinical Trial Phases for Antimicrobial Phage Therapy (AP-SA02 Context)
| Phase | Primary Objective | Typical Design | Key Quantitative Benchmarks (Industry Standards for Antimicrobials) | AP-SA02 Specific Endpoints |
|---|---|---|---|---|
| Phase I | Assess safety, tolerability, pharmacokinetics (PK). | First-in-Human (FIH), open-label or single-blind. Healthy volunteers or targeted patients. Single & multiple ascending dose (SAD/MAD) cohorts. | Sample Size: 20-100 participants. Duration: Weeks to months. Safety: Frequency/severity of Adverse Events (AEs), Dose-Limiting Toxicities (DLTs). PK: C~max~, T~max~, AUC, half-life. | Safety: AE profile specific to IV phage administration. PK: Phage circulation kinetics, clearance. Immunogenicity: Anti-phage antibody titers. |
| Phase II | Evaluate preliminary efficacy, optimal dosing, further safety. | Randomized, controlled, often double-blind. Patients with the target infection. Multiple dose regimens explored. | Sample Size: 100-300 patients. Duration: Months to 1-2 years. Efficacy: Clinical/microbiological response rates vs. placebo/standard of care (SoC). | Efficacy: Reduction in target S. aureus bacterial load. Clinical: Resolution of infection symptoms. Safety: Expanded population assessment. |
| Phase III | Confirm efficacy, monitor long-term safety, support regulatory approval. | Large-scale, randomized, double-blind, multicenter. Active comparator (SoC) or placebo + SoC. Pivotal trials. | Sample Size: 300-3000+ patients. Duration: 1-4 years. Efficacy: Primary endpoint(s) statistically powered for superiority/non-inferiority (e.g., clinical cure rate at Test-of-Cure visit). | Primary: Non-inferiority in clinical cure rate vs. SoC. Secondary: Microbiological eradication, time to resolution, safety in large population, health economics. |
| Phase IV | Post-marketing surveillance, long-term effects, additional populations. | Observational studies, registries, additional interventional studies. | Sample Size: Variable, often large. Duration: Ongoing. Goals: Identify rare AEs, optimize use in real-world settings. | Long-term safety of phage exposure. Efficacy in special populations (e.g., immunocompromised). |
Experimental Protocols for Key Assessments
Protocol: Phase I Pharmacokinetic (PK) Sampling and Titration for AP-SA02
Objective: To quantify the concentration of viable phage particles in serum over time following intravenous (IV) infusion. Materials: Sterile blood collection tubes (serum), centrifugation equipment, sterile phosphate-buffered saline (PBS), 0.45 µm filters, bacterial host strain (S. aureus target strain), soft agar, agar plates, incubator (37°C). Workflow:
- Sample Collection: Collect venous blood at pre-dose (0h) and post-dose timepoints (e.g., 5min, 30min, 1h, 2h, 4h, 8h, 12h, 24h).
- Serum Separation: Allow blood to clot, centrifuge at 2000 x g for 10 minutes. Aseptically transfer serum to a sterile tube.
- Sample Filtration: Filter serum through a 0.45 µm filter to remove bacteria, retaining phages in filtrate.
- Plaque Assay (Double-Layer Agar Method): a. Prepare molten soft agar (0.7% agar) and maintain at 45°C. b. Mix an aliquot of filtered serum (or serial 10-fold dilutions in PBS) with a log-phase culture of the host S. aureus. c. Combine mixture with 3-4 mL of soft agar and pour onto a base agar plate. Let solidify. d. Incubate plates upright at 37°C for 18-24 hours.
- Quantification: Count plaque-forming units (PFU). Calculate serum phage titer (PFU/mL), applying the dilution factor. Plot concentration-time curve to derive PK parameters (AUC, C~max~, T~max~, half-life).
Protocol: Phase II/III Primary Efficacy Endpoint Assessment – Clinical Cure
Objective: To determine the clinical response to AP-SA02 + Standard of Care (SoC) vs. Placebo + SoC in patients with complicated S. aureus bacteremia. Materials: Clinical assessment forms, microbiological culture supplies, blinded case report forms (CRFs), statistical analysis software. Workflow:
- Randomization & Blinding: Patients are randomized 1:1 to receive either AP-SA02 or matching placebo, in addition to protocol-defined SoC. All personnel and patients are blinded.
- Treatment Period: Administer study infusion (AP-SA02/Placebo) per protocol (e.g., daily IV for 7-14 days). Monitor daily for safety and clinical signs.
- Test-of-Cure (TOC) Visit: Conduct 7 days after the end of all antibiotic therapy (SoC and study drug).
- Clinical Outcome Assessment: The primary endpoint is clinical cure at the TOC visit, defined as a composite of: a. Resolution of all signs and symptoms of the index infection. b. No new signs/symptoms. c. No requirement for additional systemic antibacterial therapy for the index infection. d. Survival.
- Adjudication: A blinded, independent adjudication committee reviews all primary endpoint data to assign final outcome (Cure/Failure/Indeterminate).
- Statistical Analysis: Compare clinical cure rates between groups using a Cochran-Mantel-Haenszel test, stratified by pre-specified factors. The non-inferiority margin (Δ) is pre-defined (e.g., 10%).
Visualizations
Diagram: Phage Cocktail PK/PD Pathway
Title: Phage PK/PD and Clinical Outcome Pathway
Diagram: Clinical Trial Phase Transition Logic
Title: Clinical Trial Phase Transition Decision Flow
The Scientist's Toolkit: Research Reagent Solutions
Table 2: Essential Materials for Phage Therapy Clinical Trial Research
| Item | Function in AP-SA02 Trial Context | Example/Note |
|---|---|---|
| Host Bacterial Strain | Essential for quantifying viable phage titers (PFU) via plaque assay. Must be the susceptible target strain(s) for the cocktail components. | Isogenic S. aureus strain bank, including relevant clinical isolates (e.g., MRSA). |
| Cell Culture Media & Agar | Supports growth of host bacteria for plaque assays and phage propagation. | Tryptic Soy Broth (TSB), Tryptic Soy Agar (TSA), soft agar (0.7% agar). |
| Sterile Filtration Units | Removes bacteria from clinical samples (e.g., serum) prior to phage titer determination, preventing overgrowth in assays. | 0.45 µm syringe-driven PVDF filters. |
| Phage Storage Buffer | Maintains phage viability and stability for the clinical product (AP-SA02) and laboratory standards. | SM Buffer or proprietary formulation with stabilizers. |
| Anti-Phage Antibody ELISA Kit | Detects and quantifies host immune response (IgG, IgM, IgA) against phage cocktail components, a key safety assessment. | Custom or commercial kit for phage particle coat proteins. |
| Next-Generation Sequencing (NGS) Reagents | Monitors phage cocktail genomic stability and tracks potential shifts in phage population dynamics in vivo. | Library prep kits for metagenomic sequencing of phage DNA from serum. |
| Automated Blood Culture System | Standard of care for detecting and monitoring bacteremia in patients. Provides samples for secondary efficacy endpoints. | BACTEC or BacT/ALERT systems. |
| Clinical-Grade Placebo | Matches the AP-SA02 cocktail in appearance, packaging, and administration procedure for blinding in Phase II/III trials. | Buffer-only formulation, identical in color and viscosity. |
AP-SA02 Formulation, Stability, and Route of Administration Protocols
Within the broader thesis research on the AP-SA02 phage cocktail clinical trial protocol, the formulation, stability, and route of administration are critical determinants of clinical efficacy and safety. AP-SA02 is a lytic bacteriophage cocktail targeting Staphylococcus aureus, developed for treating acute bacterial infections. This document details application notes and standardized protocols for these core pharmaceutical development aspects, synthesized from current clinical trial data and contemporary biopharmaceutical research.
AP-SA02 Formulation Protocol
Composition & Rationale
The final drug product (FDP) is a sterile, aqueous, buffer-based solution intended for direct administration or dilution.
Table 1: AP-SA02 Final Formulation Composition
| Component | Concentration | Function & Rationale |
|---|---|---|
| AP-SA02 Phage Cocktail (3 Myoviridae phages) | ≥1 x 10^8 PFU/mL (total) | Active Pharmaceutical Ingredient (API). Provides broad-spectrum lytic activity against target S. aureus strains. |
| Sodium Chloride (NaCl) | 150 mM | Tonicity adjusting agent. Provides physiological osmolarity (~308 mOsm/kg). |
| Tris-HCl Buffer | 20 mM, pH 7.6 ± 0.2 | Maintains formulation pH stability during storage and administration. |
| Magnesium Chloride (MgCl2) | 10 mM | Divalent cation stabilizer. Enhances phage capsid integrity and adsorption to bacterial hosts. |
| Gelatin (Pharma Grade) | 0.1% (w/v) | Protective colloid. Prevents phage adsorption to container surfaces and reduces aggregation. |
| Water for Injection (WFI) | q.s. to 100% | Solvent. Meets compendial standards for parenteral products. |
Manufacturing & Aseptic Filling Protocol
Objective: To produce a sterile, stable, and potent AP-SA02 cocktail in single-use vials. Workflow Diagram Title: AP-SA02 Manufacturing & Filling Workflow
Detailed Protocol:
- Propagation: Propagate each component phage from seed stock separately in S. aureus host cultures in bioreactors until clear lysis is achieved.
- Clarification & Concentration: Centrifuge lysates (10,000 x g, 45 min, 4°C) to remove bacterial debris. Filter supernatant through 0.45 µm filters. Concentrate pooled filtrates using TFF (100 kDa MWCO).
- Formulation: Mix concentrated phage stock with pre-sterilized (autoclaved) formulation buffer containing NaCl, Tris, MgCl2, and Gelatin. Adjust final volume with WFI.
- Sterile Filtration & Filling: Perform final filtration through a 0.22 µm low-protein-binding polyethersulfone (PES) membrane. Aseptically fill 2.0 mL aliquots into sterile 5R Type I glass vials under ISO 5 laminar airflow.
- Capping & Release: Immediately seal with sterile bromobutyl rubber stoppers and aluminum caps. Perform 100% visual inspection. Release based on QC testing (sterility, endotoxin, titer, identity).
Stability Assessment Protocols
Real-Time & Accelerated Stability Study Protocol
Objective: To determine the shelf-life of AP-SA02 under recommended and stressed storage conditions.
Protocol:
- Sample Preparation: Three independent lots of AP-SA02 are stored in final product packaging.
- Storage Conditions:
- Long-Term: 2-8°C (recommended storage). Test at t=0, 3, 6, 9, 12, 18, 24, 36 months.
- Accelerated: 25°C ± 2°C / 60% RH ± 5% RH. Test at t=0, 1, 3, 6 months.
- Stress Condition: 37°C. Test at t=0, 1, 4 weeks.
- Test Parameters & Methods: At each time point, vials are assayed for:
- Potency (PFU/mL): Using double-layer agar plaque assay on host S. aureus strain.
- pH: Potentiometric determination.
- Appearance/Color/Clarity: Visual inspection against white/black background.
- Sterility: According to Ph. Eur. 2.6.1.
- Endotoxin (EU/mL): Kinetic chromogenic LAL assay.
- Identity: PCR amplification of unique genomic regions for each phage component.
Table 2: Representative AP-SA02 Stability Data Summary (Prospective)
| Storage Condition | Time Point | Mean Titer (PFU/mL) | % Initial Titer | pH | Physical Appearance | Specification Met? |
|---|---|---|---|---|---|---|
| 2-8°C | Initial (t=0) | 1.5 x 10^9 | 100% | 7.58 | Clear, colorless | Yes |
| 12 months | 1.3 x 10^9 | 87% | 7.61 | Clear, colorless | Yes | |
| 24 months | 1.1 x 10^9 | 73% | 7.59 | Clear, colorless | Yes* | |
| 25°C/60%RH | 3 months | 1.0 x 10^9 | 67% | 7.60 | Clear, colorless | Yes |
| 6 months | 7.5 x 10^8 | 50% | 7.62 | Clear, colorless | No (Titer Alert) | |
| 37°C | 4 weeks | 3.0 x 10^8 | 20% | 7.65 | Clear, colorless | No |
Proposed shelf-life: 24 months at 2-8°C.
In-Use Stability for IV Administration Protocol
Objective: To validate chemical and physical stability of AP-SA02 when diluted in IV bags.
Protocol:
- Dilution: Aseptically inject the required dose from AP-SA02 vials into 100 mL of 0.9% Sodium Chloride Injection, USP, in PVC or non-PVC (polyolefin) IV bags. Final concentration: ~1 x 10^7 PFU/mL.
- Storage & Sampling: Store diluted product at room temperature (20-25°C) under normal light. Sample at t=0, 1, 2, 4, 8, 12, and 24 hours.
- Testing: Assess titer (plaque assay), pH, visual particulates, and sterility (at t=0 and t=24h).
- Conclusion: Data supports a 4-hour in-use stability window for the diluted product at room temperature.
Route of Administration (RoA) Protocols
Based on the target indications (e.g., complex S. aureus infections, bacteremia), intravenous (IV) administration is the primary route for systemic delivery. Local/topical administration (e.g., for wound infections) is also under investigation.
Table 3: AP-SA02 Administration Routes & Key Parameters
| Route | Indication Context | Recommended Dose (Clinical Trial) | Diluent & Volume | Infusion Duration | Key Stability/Compatibility Consideration |
|---|---|---|---|---|---|
| Intravenous (IV) | Systemic infection, Bacteremia | 1 x 10^9 PFU, twice daily | 100 mL of 0.9% NaCl | 60 minutes | Compatibility with IV bag material (PVC acceptable). 4-hour chemical stability post-dilution. |
| Topical/Wound Irrigation | Localized skin/wound infection | 1 x 10^8 PFU/mL in saline-soaked gauze | 0.9% NaCl | N/A (Applied topically) | Stability on wound bed (exudates, pH). Must be re-applied daily. |
| Intra-articular (Investigational) | Prosthetic joint infection | 1 x 10^9 PFU in 10 mL | 0.9% NaCl | N/A (Injected into joint) | Compatibility with synovial fluid. Low immunogenicity risk. |
Detailed IV Administration Protocol for Clinical Staff
Title: Clinical IV Administration Workflow for AP-SA02
Step-by-Step Procedure:
- Remove one or more vials of AP-SA02 from 2-8°C storage. Allow to reach room temperature briefly.
- Aseptically withdraw the total required volume from the vial(s) using a sterile syringe.
- Inject the volume into a 100 mL bag of 0.9% Sodium Chloride Injection, USP. Use either PVC or non-PVC (polyolefin) bags. Do not use Lactated Ringer's or other electrolyte solutions without compatibility data.
- Gently invert the bag 5-10 times to ensure mixing. Do not shake vigorously.
- Inspect the diluted solution visually for particulates or discoloration before administration. It should remain clear and colorless.
- Administer immediately or within 4 hours of preparation when stored at room temperature. Infuse the total volume over 60 minutes using an infusion pump with a standard in-line particulate filter (0.2 µm pore size is acceptable as phages are ~0.2 µm in size).
- Flush the IV line with 10-20 mL of 0.9% NaCl after infusion completion.
- Document the start/end times of infusion and monitor the patient for any adverse events (AEs), particularly during the first infusion.
The Scientist's Toolkit: Key Research Reagent Solutions
Table 4: Essential Materials for AP-SA02 Formulation & Stability Research
| Item/Category | Example Product/Supplier | Function in Protocol |
|---|---|---|
| Cell Culture Media for Host Propagation | Tryptic Soy Broth (TSB), Brain Heart Infusion (BHI) | Supports robust growth of host S. aureus strain for high-titer phage propagation. |
| Tangential Flow Filtration (TFF) System | Pellicon Cassettes (100 kDa, MilliporeSigma) | Concentration and buffer exchange of phage lysates into formulation buffer; essential for purity. |
| Sterile Filtration Membranes | 0.22 µm PES membrane filters (e.g., Steritop, Millipore) | Final sterilization of formulated product without significant titer loss due to adsorption. |
| Stability Study Chambers | Climatic Chambers (e.g., Binder, ThermoFisher) | Provides precise, ICH-compliant control of temperature and humidity for accelerated/long-term stability testing. |
| Plaque Assay Materials | Double-Layer Agar (Soft Agar Overlay), Host S. aureus Strain | Gold-standard method for quantifying viable phage titer (PFU/mL) at all stability time points. |
| Endotoxin Detection Kit | Kinetic Chromogenic LAL Assay (e.g., Lonza PyroGene) | Quantifies bacterial endotoxin levels to ensure product meets parenteral specification (<5 EU/kg/hr). |
| Phage-Specific PCR Primers | Custom-designed primers for each AP-SA02 phage genome | Confirms identity and monitors potential ratio shifts of phage components during stability studies. |
| Compatible IV Bag Material | 0.9% NaCl in PVC or Polyolefin bags (e.g., Baxter, BD) | Standardized diluent matrix for in-use stability testing and clinical administration. |
Within the broader thesis on the AP-SA02 phage cocktail clinical trial protocol, determining the optimal dosing regimen is a critical translational challenge. This document outlines application notes and experimental protocols for establishing dose escalation strategies and treatment duration, bridging preclinical pharmacology with first-in-human (FIH) and later-phase clinical trials. The goal is to define a regimen that maximizes antibacterial efficacy and safety for this novel biologic.
Current Landscape: Clinical Trial Data on Phage Therapy Dosing
A live search of clinicaltrials.gov and recent literature (2023-2024) reveals limited but evolving data on intravenous bacteriophage dosing in humans. The following table summarizes key quantitative findings from recent clinical trials involving systemic phage administration.
Table 1: Summary of Recent Systemic Phage Therapy Clinical Trial Dosing Data
| Trial / Reference (Year) | Target Pathogen | Phage Cocktail / Product | Dose Escalation Range (Per Infusion) | Dosing Frequency & Duration | Key Outcomes & Rationale |
|---|---|---|---|---|---|
| PHAGE Study: Wright et al. (2023) | Pseudomonas aeruginosa in CF | AB-PA01 (4 phage mix) | Cohort 1: 1 × 10^8 PFUCohort 2: 1 × 10^9 PFUCohort 3: 1 × 10^10 PFU | Single dose, observation over 28 days. | Well-tolerated up to 10^10 PFU. PK data showed dose-dependent increase in phage levels in sputum. Supports safety of escalation by log orders. |
| Pyophage / P. aeruginosa Trial (2022) | P. aeruginosa wound infections | PP1131 (12 phage mix) | Fixed dose: ~1 × 10^6 PFU/mL, total volume variable. | BID topical application for 7 days. | Established safety for topical use. Informs duration for localized infections. |
| AP-SA01 Phase 1b/2 Trial (2021) | S. aureus bacteremia | AP-SA01 (3 phage mix) | Cohort A: 3 × 10^9 PFUCohort B: 3 × 10^10 PFU | Q12h for 14 days (IV). | Provided primary safety and preliminary efficacy data for the AP-SA platform, directly informing AP-SA02 escalation design. |
| E. coli Phage Therapy Case Series (2023) | Multi-drug resistant E. coli | Custom cocktails | 1 × 10^9 to 1 × 10^11 PFU Q12H-Q24H. | Variable, 10-42 days based on clinical response. | Suggests need for flexible, prolonged duration in complex infections. Highlights monitoring for neutralising antibodies. |
Core Experimental Protocols for Preclinical Dosing Rationale
Protocol 3.1: Maximum Tolerated Dose (MTD) & Repeat-Dose Toxicology Study in Animal Models
Objective: To establish the safety profile and identify a No Observed Adverse Effect Level (NOAEL) to inform the starting dose for clinical trials. Materials: AP-SA02 phage cocktail (GMP-grade), rodent and non-rodent species (e.g., mice, Sprague-Dawley rats), infusion pumps, ELISA kits for cytokine analysis, clinical pathology analyzers. Procedure:
- Dose Selection: Determine high dose based on Maximum Feasible Dose (MFD) or a large multiple of the anticipated clinical dose. Set middle and low doses as log-based fractions.
- Animal Randomization: Randomly assign animals (n=10/sex/group for rodents, n=3/sex/group for non-rodents) to Vehicle control, Low, Mid, and High dose groups.
- Dosing Regimen: Administer AP-SA02 via intravenous bolus or infusion, simulating the intended clinical route. Conduct daily dosing for 7-14 days (sub-acute) and 28 days (chronic).
- In-life Observations: Record clinical signs, body weight, and food consumption twice daily.
- Terminal Analysis: At scheduled sacrifices, collect blood for hematology, clinical chemistry, and cytokine profiling (TNF-α, IL-6, IL-1β). Perform gross necropsy and histopathology on all major organs.
- Data Analysis: Identify the MTD and NOAEL. Calculate the Human Equivalent Dose (HED) using allometric scaling.
Protocol 3.2: Pharmacokinetic/Pharmacodynamic (PK/PD) Modeling in anIn VivoEfficacy Model
Objective: To correlate phage exposure (PK) with bacterial killing (PD) to predict effective dosing regimens. Materials: Neutropenic murine thigh or lung infection model with relevant S. aureus strains, AP-SA02 cocktail, tissue homogenizer, plaque assay materials, bioanalytical software (e.g., WinNonlin). Procedure:
- Infection Model: Render mice neutropenic via cyclophosphamide. Inoculate thigh muscle or lungs with a defined inoculum (e.g., 10^6 CFU) of the target S. aureus strain.
- Phage Dosing: At 2h post-infection, administer a single IV dose of AP-SA02 across a range (e.g., 10^7, 10^8, 10^9 PFU/mouse). Include a vehicle control.
- Sample Collection: Sacrifice cohorts (n=4/time point) at pre-defined times (e.g., 5min, 30min, 2h, 6h, 24h). Collect blood (for serum) and target tissue.
- Titer Quantification: Homogenize tissues. Quantify bacterial burden (CFU/organ) and phage concentration (PFU/mL in serum, PFU/organ in tissue) via plaque assay.
- Modeling: Fit phage serum concentration-time data to a 2-compartment PK model. Integrate bacterial kill curves to develop a PK/PD model linking AUC or Cmax of phage to the reduction in bacterial load (Δlog10 CFU).
- Simulation: Use the model to simulate various human dosing regimens (Q12h, Q24h) and predict efficacious human doses.
Protocol 3.3:In VitroDynamic Model of Resistance Prevention
Objective: To determine the treatment duration and phage concentration required to suppress bacterial regrowth and resistance emergence. Materials: Multi-channel chemostat or bioreactor system, AP-SA02 and its constituent phages, target S. aureus strain, automated sampling system. Procedure:
- System Setup: Inoculate the dynamic culture system with S. aureus at ~10^5 CFU/mL in simulated physiological media. Set a fixed dilution rate to mimic bacterial growth in vivo.
- Phage Challenge: Initiate continuous or pulsed infusion of AP-SA02 at a pre-defined Multiplicity of Infection (MOI). Test multiple MOIs (0.1, 1, 10) and treatment durations (24h, 48h, 72h).
- Monitoring: Sample effluent hourly for the first 12h, then every 6-12h. Quantify bacterial density (CFU/mL) and phage titer (PFU/mL).
- Resistance Screening: Plate samples on phage-containing agar at each time point to enumerate and characterize phage-resistant mutants.
- Endpoint Analysis: Determine the minimum phage concentration and treatment duration required to maintain bacterial suppression below the detection limit and prevent outgrowth of resistant populations.
Visualization: Decision Logic for Clinical Dose Escalation
Title: Clinical Dose Escalation Decision Logic
The Scientist's Toolkit: Research Reagent Solutions
Table 2: Essential Materials for Phage Dosing & Regimen Studies
| Item | Function & Relevance to Dosing Studies |
|---|---|
| GMP-Grade AP-SA02 Cocktail | The investigational product for clinical dosing. Must be characterized for titer, purity, sterility, and endotoxin levels. |
| Plaque Assay Materials (Agar, soft agar, host bacteria) | The gold-standard for quantifying viable phage particles (PFU/mL) in PK samples, stability studies, and potency assays. |
| Cytokine Profile ELISA Kits (TNF-α, IL-6, IL-1β, IFN-γ) | Critical for assessing potential immune-mediated reactions (e.g., cytokine release) during toxicology and dose escalation. |
| Automated Liquid Handling System | Ensures precision and reproducibility in setting up high-throughput plaque assays and serial dilutions for PK/PD samples. |
| Pharmacokinetic Modeling Software (WinNonlin, Phoenix) | Used to analyze serum concentration-time data, calculate PK parameters (AUC, Cmax, t1/2), and develop PK/PD models for dose prediction. |
| Neutropenic Mouse Infection Model | Provides a standardized in vivo system for evaluating the efficacy of different dosing regimens (dose, frequency, duration) against target pathogens. |
| Dynamic In Vitro Chemostat System | Models the dynamic conditions of an infection site, allowing study of phage-bacteria kinetics and resistance emergence under various dosing schedules. |
| Anti-Phage Neutralizing Antibody Assay | Detects host immune response against phages, which can impact PK and efficacy, informing treatment duration and re-dosing strategies. |
Within the broader thesis on the AP-SA02 phage cocktail clinical trial protocol, the precise definition of endpoints is paramount. This document details the application notes and protocols for establishing primary and secondary endpoints across clinical, microbiological, and pharmacokinetic (PK) domains for a Phase II trial assessing AP-SA02 in patients with chronic Staphylococcus aureus bacteremia. Endpoints must be clearly defined, measurable, and aligned with regulatory guidance to demonstrate efficacy and safety.
The following tables summarize the proposed quantitative endpoints for the AP-SA02 trial.
Table 1: Primary and Secondary Clinical Endpoints
| Endpoint Category | Specific Endpoint | Measurement Method | Timepoint | Success Threshold (Proposed) |
|---|---|---|---|---|
| Primary Clinical | All-cause mortality | Patient survival status | Day 28 | Non-inferiority margin of <10% difference vs. SOC |
| Secondary Clinical | Clinical cure resolution of S. aureus bacteremia symptoms | Syndromic assessment (e.g., SOFA score, fever) | Day 7, Day 14, Day 28 | ≥20% improvement vs. SOC |
| Secondary Clinical | Adverse Event (AE) Incidence | CTCAE v5.0 grading | Throughout trial + 30-day follow-up | Comparable or lower rate vs. SOC |
| Secondary Clinical | Hospital Length of Stay | Days from first dose to discharge | End of hospitalization | Reduction of median stay by ≥2 days |
Table 2: Microbiological and Pharmacokinetic Endpoints
| Endpoint Category | Specific Endpoint | Measurement Method | Timepoint | Success Threshold (Proposed) |
|---|---|---|---|---|
| Primary Microbiological | Microbial clearance of S. aureus from blood | Quantitative blood culture (CFU/mL) | Serial measures: Baseline, 24h, 48h, 72h, Day 7 | Time to negativity <72h; ≥1 log10 CFU/mL reduction at 24h |
| Secondary Microbiological | Emergence of phage resistance | Plaque assay & MIC against phage cocktail | Baseline, Treatment failure, End of therapy | <5% of isolates show >4x increase in phage MIC |
| Secondary PK | Serum Phage Titer (AP-SA02) | Double-layer agar plaque assay | Pre-dose, 0.5h, 2h, 6h, 24h post-infusion | Detectable titer (>1e3 PFU/mL) sustained for 6h post-dose |
| Secondary PK | Phage Biodistribution (in subset) | qPCR for phage DNA in non-blood sites (e.g., abscess fluid) | At time of clinically required drainage | Detection of phage DNA in >60% of target sites |
Experimental Protocols
Protocol 2.1: Quantitative Measurement of Bacterial Clearance from Blood
Objective: To serially quantify S. aureus burden in patient blood. Materials: BACTEC aerobic blood culture bottles, sterile syringes, phosphate-buffered saline (PBS), Tryptic Soy Agar (TSA). Procedure:
- Collect 20mL blood via aseptic venipuncture at defined timepoints.
- Inoculate 10mL into a BACTEC bottle for qualitative positivity/negativity.
- Serially dilute the remaining 10mL in PBS (10^-1 to 10^-5).
- Plate 100µL of each dilution in triplicate on TSA plates.
- Incubate plates at 37°C for 24-48 hours.
- Count colony-forming units (CFU) and calculate mean CFU/mL of blood.
- Plot log10 CFU/mL versus time to determine clearance kinetics.
Protocol 2.2: Plaque Assay for Serum Phage Titration and Resistance Monitoring
Objective: To quantify active phage particles in patient serum and assess bacterial isolate susceptibility. Materials: Soft agar (0.7% TSA), hard agar (1.5% TSA), early-log phase S. aureus host strain (propagating strain), patient serum samples, sterile filter units (0.22µm). Procedure for Serum Titer:
- Filter serum samples through a 0.22µm filter to remove bacteria.
- Perform 10-fold serial dilutions of filtered serum in PBS.
- Mix 100µL of each dilution with 200µL of host bacteria (OD600 ~0.3).
- Incubate mixture at 37°C for 10 minutes.
- Add mixture to 3mL soft agar, vortex, and pour over a hard agar plate.
- Allow agar to solidify, invert, and incubate at 37°C overnight.
- Count plaques and calculate titer as Plaque-Forming Units per mL (PFU/mL). Procedure for Resistance Screening:
- Isolate S. aureus from patient blood cultures at relevant timepoints.
- Use the plaque assay above, substituting the patient's own isolate as the host lawn.
- Challenge with a standardized AP-SA02 cocktail (e.g., at 1e8 PFU/mL).
- Compare plaque formation efficiency (EOP) relative to the reference strain. EOP <10^-4 suggests reduced susceptibility.
Protocol 2.3: Pharmacokinetic Sampling and qPCR for Biodistribution
Objective: To measure phage concentration in blood over time and detect phage DNA in secondary sites. Materials: Serum separator tubes, DNA extraction kit (e.g., QIAamp DNA Mini Kit), qPCR reagents, primers/probes specific for each phage component of AP-SA02. PK Sampling Workflow:
- Draw blood at pre-dose (trough), 30min, 2h, 6h, and 24h post-initiation of phage infusion.
- Process serum by centrifugation (2000xg, 10min) and aliquot.
- One aliquot for immediate plaque assay (Protocol 2.2). A second aliquot stored at -80°C for potential qPCR. qPCR for Tissue/Abscess Fluid:
- Extract total DNA from 200µL of abscess fluid or tissue homogenate.
- Perform multiplex qPCR using TaqMan probes unique to each phage genome in the cocktail.
- Generate standard curves using known quantities of each phage DNA.
- Report results as phage genome copies per mL or per gram of tissue.
The Scientist's Toolkit: Research Reagent Solutions
Table 3: Essential Materials for Endpoint Assessment
| Item | Function in AP-SA02 Trial Research |
|---|---|
| BACTEC FX Automated Blood Culture System | For sensitive, qualitative detection of bacteremia and time-to-positivity data. |
| Quantitative PCR System (e.g., Applied Biosystems 7500) | For sensitive, specific detection and quantification of phage DNA in PK/biodistribution studies. |
| Phage-Specific TaqMan Assays | Custom primer/probe sets to distinguish and quantify individual phages in the AP-SA02 cocktail from clinical samples. |
| Standardized S. aureus Host Panel | A panel of well-characterized S. aureus strains (including common lineages) for consistent phage potency and resistance assays. |
| Cytokine & Inflammation Panel (Luminex/MSD) | To measure host immune response (e.g., IL-6, CRP, TNF-α) as an exploratory pharmacodynamic endpoint. |
| 0.22µm PVDF Syringe Filters | For sterile filtration of serum prior to plaque assay, removing bacteria while allowing phage passage. |
Visualizations
Title: Integrated PK and Microbiological Assessment Workflow
Title: Hierarchy of Primary and Secondary Endpoints
Overcoming Hurdles in Phage Cocktail Trials: Mitigation and Adaptive Strategies
Application Notes: Within the Context of AP-SA02 Phage Cocktail Clinical Trial Protocol Research
The development of the AP-SA02 phage cocktail for targeting Staphylococcus aureus represents a significant advance in bacteriophage therapy. However, the evolution of phage resistance in bacterial populations is a critical challenge that must be proactively addressed within the clinical trial framework. This document outlines a dual-strategy approach focusing on rational cocktail design to preempt resistance and robust monitoring plans to detect and characterize it during clinical investigations.
Rational Cocktail Design: Principles and Quantitative Assessment
Effective cocktail design aims to deploy phages that collectively impose a high genetic fitness cost on resistance development, often through the use of phages targeting diverse, essential receptors. For AP-SA02, which targets S. aureus, the cocktail is formulated based on the following principles:
- Receptor Diversity: Phages are selected to utilize distinct, non-overlapping surface receptors (e.g., wall teichoic acids (WTA), β-N-acetylglucosamine (GlcNAc) residues, proteinaceous receptors).
- Synergistic Effects: Inclusion of phages with complementary lytic activities, including virulent phages and engineered phages with depolymerase activity.
- Evolutionary Trapping: Phages are chosen where resistance to one component (e.g., receptor mutation) sensitizes the bacterium to another component or to conventional antibiotics (phage-antibiotic synergy, PAS).
Table 1: Quantitative Profile of a Model Phage Cocktail Component (AP-SA02 Series)
| Component ID | Putative Primary Receptor | Plaque Size (mm) | Burst Size (PFU/infected cell) | Latent Period (min) | Host Range (% of 50 Clinical Isolates Lysed) | Cross-Resistance Profile with Other Components |
|---|---|---|---|---|---|---|
| AP-SA02Φ1 | WTA (α-GlcNAc) | 2.1 ± 0.3 | 120 ± 25 | 25 ± 5 | 94% | Low (<5% co-resistance with Φ2, Φ3) |
| AP-SA02Φ2 | β-GlcNAc | 1.8 ± 0.4 | 85 ± 15 | 30 ± 7 | 88% | Low (<8% co-resistance with Φ1, Φ3) |
| AP-SA02Φ3 | Unknown Protein | 3.0 ± 0.5 | 200 ± 40 | 20 ± 4 | 76% | Moderate (15% co-resistance with Φ4) |
| AP-SA02Φ4 | (Engineered) Depolymerase+ | 2.5 ± 0.3 | 95 ± 20 | 35 ± 5 | 82% | See Φ3 |
Experimental Protocols for Resistance Assessment
Protocol 2.1:In VitroSerial Passage Resistance Induction
Objective: To assess the rate and mechanisms of resistance emergence against individual cocktail components and the full cocktail. Materials: Target bacterial strain (e.g., S. aureus trial isolate), individual phage stocks, complete AP-SA02 cocktail, broth media, sterile multi-well plates.
- Inoculate 200 µL of broth with ~10^6 CFU of bacteria in a 96-well plate.
- Add individual phage or cocktail at a starting Multiplicity of Infection (MOI) of 0.1.
- Incubate with shaking at 37°C for 18-24h.
- Harvest 10 µL of culture and transfer to a new well containing 190 µL of fresh medium and fresh phage(s). Repeat for 15-20 serial passages.
- At each passage, spot culture supernatant on a lawn of the original bacterial strain to confirm phage presence. Store resistant isolates from turbid wells for characterization.
- Endpoint Analysis: Determine phage susceptibility (spot assay/EOP), growth kinetics, and antibiotic susceptibility (MIC) of evolved isolates vs. ancestral strain.
Protocol 2.2: Efficiency of Plating (EOP) Assay for Resistance Phenotyping
Objective: Quantitatively measure the development of resistance.
- Prepare soft agar overlays containing ~10^8 CFU of the bacterial isolate to be tested (ancestral or evolved).
- Spot 10 µL of serial ten-fold dilutions of relevant phage stock(s) onto the solidified overlay.
- Allow spots to dry, incubate plate overnight at 37°C.
- Count plaques. Calculate EOP as (Plaque count on evolved isolate / Plaque count on ancestral isolate).
- Interpretation: EOP < 10^-4 is considered indicative of strong resistance.
Protocol 2.3: Genomic Analysis of Phage-Resistant Mutants
Objective: Identify genetic mutations conferring phage resistance.
- Extract genomic DNA from ancestral and resistant bacterial isolates (Kit-based protocol).
- Prepare sequencing libraries (e.g., Illumina NovaSeq 6000, 2x150 bp).
- Perform whole-genome sequencing (WGS).
- Bioinformatic Analysis: a. Trim reads and align to reference genome. b. Call variants (SNPs, indels) using tools like Breseq or Snippy. c. Annotate mutations, focusing on genes related to surface structures (e.g., tagO, tarM, tarS for WTA), putative phage receptors, and regulatory genes (e.g., walKR, graRS).
- Correlate genotypes with phenotypic resistance profiles.
Clinical Trial Resistance Monitoring Plan
Within the AP-SA02 clinical trial protocol, resistance monitoring will be integrated as follows:
Pre-Treatment: WGS of the baseline infecting S. aureus isolate. During Treatment: Regular collection of target site samples (e.g., wound swabs) at defined intervals (e.g., Days 3, 7, 14). Post-Treatment: Collection of any late recurrence isolates. Sample Analysis:
- Culture samples and isolate single S. aureus colonies.
- Screen isolates for reduced susceptibility via a modified Kirby-Bauer using phage-impregnated disks or spot assay.
- Perform EOP assays on isolates showing reduced susceptibility.
- Perform WGS on all phenotypically resistant isolates and a random subset of susceptible isolates for comparison.
Table 2: Clinical Resistance Monitoring Schedule & Actions
| Time Point | Sample Type | Primary Analysis | Trigger for Escalated Analysis | Action |
|---|---|---|---|---|
| Baseline (Day 0) | Clinical isolate | WGS, susceptibility to AP-SA02 | N/A | Establish genotype & phenotype baseline. |
| On-Therapy (Day 3, 7) | Target site swab | Culture, phage spot assay | Failure to lyse at routine test dilution (RTD) | EOP assay, initiate WGS. Inform DSMB. |
| End-of-Therapy (Day 14) | Target site swab | Culture, phage spot assay | Any resistant colony detected | Full EOP against all cocktail components, WGS. |
| Follow-up (Day 28, 60) | Clinical isolate if recurrence | Full susceptibility profiling | Any recurrence | Full phenotypic & genotypic characterization. Correlate with clinical outcome. |
Visualizations
Diagram 1: Cocktail Design Principles Against Resistance
Diagram 2: Clinical Resistance Monitoring Workflow
The Scientist's Toolkit: Key Research Reagent Solutions
Table 3: Essential Materials for Phage Resistance Studies
| Item | Function/Benefit in Resistance Studies | Example/Notes |
|---|---|---|
| Phage Cocktail Stock | The therapeutic/intervention agent for in vitro and in vivo challenge experiments. | AP-SA02 GMP-grade stock for clinical trials; purified high-titer stocks for lab studies. |
| Isogenic Bacterial Strain Panel | Provides a controlled genetic background to study resistance mutations. | Parental S. aureus strain (e.g., JE2, Newman) and its defined mutant library (e.g., Nebraska Transposon Library). |
| Clinical & Environmental S. aureus Isolates | Assesses host range and real-world resistance potential. | Diverse collection representing major clonal complexes (CC1, CC5, CC8, CC30, CC45). |
| Next-Gen Sequencing Kit | Enables WGS of resistant mutants for mutation identification. | Illumina DNA Prep or Nextera XT for library prep. Critical for genomic analysis protocol (2.3). |
| Automated MIC System | Efficiently measures changes in antibiotic susceptibility post-resistance evolution (PAS). | Systems like VITEK 2 or broth microdilution panels. |
| Cell Lysis & DNA Cleanup Kits | For rapid, consistent genomic DNA extraction from bacterial isolates. | DNeasy Blood & Tissue Kit (Qiagen) or similar. |
| Bioinformatic Analysis Pipeline | Standardizes variant calling from WGS data. | Tools: FastQC (QC), Trimmomatic (trimming), BWA (alignment), SAMtools, Breseq (variant calling). |
| Phage Storage Buffer | Maintains long-term phage viability for consistent challenge experiments. | SM Buffer (NaCl, MgSO₄, Tris-HCl, gelatin) at 4°C or with cryoprotectants at -80°C. |
Patient Recruitment Challenges for Novel Antimicrobials and Solutions
This document details the specific patient recruitment challenges encountered within the broader clinical trial protocol research for the AP-SA02 phage cocktail, a novel bacteriolytic agent targeting Staphylococcus aureus. The development of novel antimicrobials, particularly those employing non-traditional mechanisms like phage therapy, faces unique hurdles in identifying and enrolling suitable participants within a viable timeline. These challenges directly impact the feasibility, cost, and ultimate success of pivotal trials.
The primary barriers to patient recruitment for trials of novel antimicrobials like AP-SA02 are summarized in the table below.
Table 1: Major Patient Recruitment Challenges and Impact Metrics
| Challenge Category | Specific Hurdle | Typical Impact Metric (Industry Benchmark) | AP-SA02 Trial Specificity |
|---|---|---|---|
| Stringent Inclusion Criteria | Requirement for culture-confirmed, monomicrobial infection with a specific pathogen (e.g., MRSA). | >80% of screened patients are excluded due to microbiology criteria. | Requires confirmed S. aureus infection, often excluding polymicrobial wounds. |
| Competition with Standard of Care (SoC) | Clinicians' reluctance to randomize critically ill patients to an investigational product. | Recruitment rates can be 30-50% lower in life-threatening infections. | Phage therapy may be seen as a last resort, delaying referral. |
| Limited Awareness & Diagnostic Lag | Slow pathogen identification/antibiogram delays confirmation of eligibility. | Screening-to-enrollment conversion can take 5-10 days. | Susceptibility to AP-SA02 must be confirmed via phage susceptibility testing, adding steps. |
| Regulatory & Logistical Hurdles | Complexities with compassionate use/expanded access pathways siphoning potential participants. | Up to 15% of potentially eligible patients may enter alternative access programs. | Phage therapy's regulatory "novelty" requires extensive protocol education at sites. |
| Geographic Dispersion of Cases | Target infections (e.g., acute diabetic foot infections) are spread across numerous centers, none with high volume. | Often requires >50 sites internationally to meet enrollment goals. | Need for sites with both clinical microbiology and phage research expertise further limits site options. |
Proposed Solutions & Experimental Protocols for Feasibility Assessment
To overcome these challenges, the following application notes and protocols are recommended for integration into the AP-SA02 trial master protocol.
Protocol: Pre-Site Activation Laboratory Feasibility & Capacity Audit
Objective: To objectively assess and ensure each potential clinical site's capability to handle the specific microbiological requirements for AP-SA02 screening. Methodology:
- Distribute Mock Clinical Isolates: Ship a panel of 5-10 blinded bacterial isolates (including S. aureus strains with varying phage susceptibilities, non-target Gram-positive, and Gram-negative bacteria) to the site's microbiology lab.
- Protocolized Testing Workflow:
- The lab processes each isolate as per the trial's laboratory manual.
- Steps include: culture confirmation, species ID (e.g., MALDI-TOF), storage, and shipment of the isolate to the central phage susceptibility testing lab.
- The site performs a local phage susceptibility assay using a provided AP-SA02 surrogate reagent (non-therapeutic phage mix) following a standardized agar spot assay protocol.
- Data Submission & Metrics: Sites submit results for accuracy (100% correct ID), turnaround time (<48h from receipt to shipment), and assay performance. A score >90% is required for activation.
- Re-Mediation: Sites failing the audit receive targeted training and a re-audit before activation.
Diagram Title: Site Lab Feasibility Audit Workflow
Protocol: Adaptive, Biomarker-Enhanced Patient Screening
Objective: To reduce the screening failure rate by implementing a rapid, centralized molecular pre-screening step. Methodology:
- Point-of-Care Sample Collection: At initial patient presentation, the site collects a standard clinical sample (e.g., wound swab) and also places the same swab into a nucleic acid stabilization buffer.
- Express Shipment & Centralized qPCR: The stabilized sample is express-shipped to a central lab. Within 24 hours of receipt, the lab performs a multiplex qPCR assay targeting:
- S. aureus-specific gene (e.g., nuc).
- Methicillin resistance gene (mecA).
- Pan-bacterial 16S rRNA (to assess polymicrobial load).
- Real-Time Eligibility Triage: qPCR results (positive for S. aureus, negative for heavy polymicrobial signal) trigger an immediate "Proceed to Full Culture" alert to the site, allowing them to fast-track the patient in the consent and full screening process while conventional culture is ongoing.
- Confirmation: Final eligibility remains contingent on culture confirmation and central phage susceptibility testing from the cultured isolate.
Diagram Title: Adaptive Molecular Pre-Screening Protocol
The Scientist's Toolkit: Research Reagent Solutions
Table 2: Essential Materials for Phage Trial Recruitment Feasibility Work
| Item | Function in Protocol | Example/Note |
|---|---|---|
| Stabilized Nucleic Acid Transport Medium | Preserves pathogen DNA/RNA at room temperature for express shipment to central qPCR lab, critical for the adaptive screening protocol. | e.g., DNA/RNA Shield or similar. |
| Multiplex qPCR Assay Kit (IVD or RUO) | Enables rapid, specific detection of target pathogen (S. aureus), resistance markers, and bacterial load from stabilized samples. | Must be validated for use with the chosen transport medium. |
| Phage Susceptibility Testing Agar | Specialized media with defined calcium/magnesium levels for optimal phage adsorption and plaque formation during site audits and central testing. | e.g., TSA with 10mM CaCl₂. |
| Audit Panel of Characterized Bacterial Isolates | A biobank of well-defined, stable bacterial strains used to objectively test site laboratory proficiency prior to activation. | Includes target, near-neighbor, and non-target strains. |
| Clinical Trial Management System (CTMS) with Integrated Lab Data | Software platform that allows real-time integration of central lab qPCR and phage susceptibility results into patient screening dashboards. | Enables dynamic eligibility status updates. |
| Standardized Patient Referral Mobile App/Portal | A simple digital tool for community physicians to quickly refer potential patients to trial sites, including preliminary case details. | Reduces referral friction and increases awareness. |
Manufacturing and Quality Control (CMC) Hurdles for GMP Phage Production
Application Notes: CMC Challenges in AP-SA02 Cocktail Development
The advancement of the AP-SA02 phage cocktail, a therapeutic candidate targeting Staphylococcus aureus, into clinical trials necessitates overcoming significant Chemistry, Manufacturing, and Controls (CMC) hurdles under Good Manufacturing Practice (GMP). Key challenges include the reproducible production of high-titer, pure phage stocks, the standardization of multi-phage cocktail composition, and the validation of purification processes that remove endotoxins and host cell residuals.
Critical quality attributes (CQAs) for a GMP-grade phage cocktail include titer (≥10^9 PFU/mL), purity (absence of bacterial DNA, proteins, and endotoxins <5 EU/mL), sterility, genetic stability, and cocktail ratio fidelity. Process variability in fermentation, lysis efficiency, and chromatographic purification directly impacts these attributes. The following data, compiled from recent literature and industry reports, summarizes current benchmarks and hurdles.
Table 1: Key CMC Specifications and Current Challenges for GMP Phage Production
| Critical Quality Attribute (CQA) | Target Specification | Common GMP Challenge | Typical Current Yield/Result (Post-Purification) |
|---|---|---|---|
| Potency (Total Phage Titer) | ≥1 x 10^11 PFU/batch | Scalable cell lysis methods; maintaining titer through purification | 1 x 10^10 - 1 x 10^11 PFU/mL |
| Endotoxin Level | <5 Endotoxin Units (EU)/mL | Effective removal from gram-negative host lysate | 10-100 EU/mL pre-purification; <5 EU/mL post-polishing |
| Host Cell Protein (HCP) | <100 ng/mL | Validation of clearance during filtration/chromatography | ~1,000 ng/mL post initial purification |
| Host Cell DNA | <10 ng/dose | Nuclease treatment efficiency and validation | <100 ng/dose post-DNase treatment |
| Cocktail Ratio Consistency | ±5% of target PFU ratio | Differential replication rates of constituent phages in co-culture | ±15-20% variance in individual phage titers |
| Sterility | Sterile (Ph. Eur. 2.6.1) | Mycoplasma and bioburden control in bioreactors | Achievable with 0.22 µm filtration |
| Genetic Stability | No mutations in tail fiber/target genes over 50 passages | Selective pressure during large-scale fermentation | Drift observed after 20-30 serial passages |
Detailed Protocols
Protocol 1: Tangential Flow Filtration (TFF) for Phage Concentration and Purification
Objective: Concentrate phage lysate and exchange buffer while removing host cell debris and reducing endotoxins. Materials: Pellicon 2 or similar TFF system with 100kD MWCO PES membranes, peristaltic pump, pressure gauges, Phage Buffer (e.g., SM Buffer). Method:
- System Setup & Equilibration: Assemble TFF system with 100kD hollow fiber filter. Flush system with DI water, then equilibrate with 500 mL of Phage Buffer.
- Clarified Lysate Load: Filter cell lysate through a 0.45 µm filter to remove large debris. Load clarified lysate into the feed reservoir.
- Diafiltration: Start recirculation. Apply a transmembrane pressure (TMP) of 10-15 psi. Begin diafiltration by continuously adding Phage Buffer to the reservoir at the same rate as permeate removal. Perform 10 volume exchanges.
- Concentration: After diafiltration, close the diafiltration line and continue filtration until the retentate volume is reduced 10-fold.
- Recovery: Flush the retentate line with 20 mL of Phage Buffer to recover maximum phage. Filter the final concentrate through a 0.22 µm sterile filter.
- Analysis: Determine phage titer (via double-layer agar assay) and endotoxin level (via LAL assay).
Protocol 2: Anion-Exchange Chromatography for Endotoxin and DNA Removal
Objective: Polish phage preparation by removing residual endotoxins and host nucleic acids. Materials: ÄKTA pure system, Capto Q ImpRes column, Buffer A (20 mM Tris, pH 7.5), Buffer B (20 mM Tris, 1 M NaCl, pH 7.5), TFF-concentrated phage sample. Method:
- Sample Preparation: Dialyze or dilute the TFF-concentrated sample into Buffer A until conductivity is <5 mS/cm.
- Column Equilibration: Equilibrate the Capto Q column with 5 column volumes (CV) of Buffer A at a flow rate of 1 mL/min.
- Sample Load: Load the prepared sample onto the column. Phages typically flow through in this condition, while endotoxins and DNA bind.
- Wash & Elution: Wash with 5 CV of Buffer A to collect the phage-containing flow-through and wash fractions. Elute bound contaminants with a step gradient to 100% Buffer B.
- Regeneration & Storage: Clean the column with 1 M NaOH, then re-equilibrate with Buffer A.
- Analysis: Pool phage-positive fractions (determined by spot titer). Measure titer, endotoxin (target <5 EU/mL), and residual DNA (qPCR).
Visualizations
Title: GMP Phage Downstream Processing Workflow
Title: Key Process Parameters Impacting Phage CQAs
The Scientist's Toolkit: Research Reagent Solutions for Phage CMC
| Item/Category | Function in Phage CMC | Example Product/Technology |
|---|---|---|
| GMP Host Cell Bank | Provides standardized, qualified bacterial host for consistent phage replication. Essential for regulatory filing. | Master Cell Bank of E. coli or target pathogen (e.g., S. aureus SA003 for AP-SA02) in cryovials. |
| Cell Disruption Reagents | Chemically lyses bacterial host to release phage progeny. Must be effectively removed later. | Chloroform (for gram-negative), MIT (β-lactam antibiotic for gram-positive), or detergent-based solutions. |
| Nuclease Enzymes | Degrades host genomic DNA and RNA to reduce viscosity and residual DNA contamination. | Benzonase Endonuclease (GMP-grade), must be validated for removal. |
| Endotoxin Removal Resins | Specifically binds and removes lipid A component of endotoxins during chromatography. | Capto core700, Capto adhere, or multimodal anion exchangers. |
| Tangential Flow Filtration (TFF) | Concentrates phage and performs buffer exchange via diafiltration. Key for volume reduction. | Pellicon 2 or 3 cassettes with 100-300kD MWCO Ultracel membranes. |
| Size-Exclusion Chromatography (SEC) | Final polishing step to remove aggregates and small-molecule impurities. | HiPrep Sephacryl S-500 HR or similar large-pore resins. |
| qPCR Assay Kits | Quantifies residual host cell DNA to meet stringent purity specifications (<10 ng/dose). | Host-specific qPCR assay (e.g., for S. aureus nuc gene). |
| LAL Endotoxin Assay | Gold-standard test for quantifying endotoxin levels in final drug substance. | Kinetic chromogenic LAL assay (e.g., Lonza PyroGene). |
| Stability Testing Chambers | Supports real-time and accelerated stability studies of final drug product (liquid or lyophilized). | ICH-compliant stability chambers controlling temperature and humidity. |
Standardizing and Validating Microbiological Assays for Phage Activity
The AP-SA02 phage cocktail, targeting Staphylococcus aureus, is under investigation in clinical trials for its efficacy against chronic rhinosinusitis and other bacterial infections. A core requirement for its clinical development is the standardization and validation of robust, reproducible microbiological assays. These assays are critical for potency determination, stability studies, lot release, and the assessment of resistance development. This document provides application notes and detailed protocols for key assays, framed within the needs of a GLP/GMP-compliant drug development pathway.
Table 1: Key Performance Indicators for Validated Phage Assays (Target Criteria)
| Assay Parameter | Target Acceptance Criterion | Typical Value for AP-SA02 | Purpose |
|---|---|---|---|
| Plaque Assay Linearity (R²) | ≥ 0.98 | 0.99 | Quantitative titer determination |
| Plaque Assay Repeatability (%RSD) | ≤ 15% | 5-8% | Intra-day precision |
| Plaque Assay Intermediate Precision (%RSD) | ≤ 20% | 10-12% | Inter-day, inter-analyst precision |
| Efficiency of Plating (EOP) | 0.5 - 2.0 | 0.8 - 1.2 (vs reference host) | Relative potency on clinical isolates |
| MIC of Antibiotics (Control) | Within CLSI range | As per CLSI standards | Assay control and combo studies |
| Killing Curve Log Reduction | ≥ 3-log in 24h | 4-5 log reduction (in vitro) | Efficacy assessment |
Table 2: Example AP-SA02 Characterization Data
| Phage Component | Plaque Morphology | Host Range (% of Clinical S. aureus Isolates Lysed) | Stability at 4°C (Log Titer Loss/Year) |
|---|---|---|---|
| Myovirus SA01 | Large, clear (2-3 mm) | 92% | < 0.5 |
| Podovirus SA02 | Small, turbid (0.5-1 mm) | 87% | < 0.3 |
| Cocktail (AP-SA02) | Mixed morphology | 98% | < 0.4 |
Detailed Experimental Protocols
Protocol 3.1: Standardized Double-Layer Agar Plaque Assay for Titer Determination
Purpose: To quantify viable phage particles (PFU/mL) in AP-SA02 samples. Reagents: Tryptic Soy Broth (TSB), Tryptic Soy Agar (TSA), Soft Agar (TSB + 0.5% agar), host S. aureus strain (e.g., ATCC 29213), AP-SA02 sample, SM Buffer. Procedure:
- Host Culture: Grow host S. aureus to mid-exponential phase (OD600 ≈ 0.4-0.6) in TSB.
- Sample Preparation: Serially dilute the AP-SA02 sample in SM buffer across 8 log steps.
- Inoculation: Mix 100 µL of bacterial culture with 100 µL of each phage dilution. Incubate at 37°C for 15 min for adsorption.
- Plating: Add 3 mL of molten soft agar (45°C) to each mixture and pour immediately onto a pre-warmed TSA plate. Swirl gently to ensure even distribution.
- Incubation: Let plates solidify, then invert and incubate at 37°C for 18-24 hours.
- Enumeration: Count plaques on plates with 20-200 distinct plaques. Calculate PFU/mL: (Plaque count) / (Dilution factor × Volume plated). Validation Notes: Perform triplicate independent assays. Include a negative control (buffer only) and a positive control (phage reference standard).
Protocol 3.2: Efficiency of Plating (EOP) Assay
Purpose: To compare the plating efficiency of AP-SA02 on a clinical isolate versus the propagated host strain. Procedure:
- Perform the standard plaque assay (Protocol 3.1) simultaneously using the reference host strain and the target clinical isolate.
- Determine the mean plaque titer on both strains.
- Calculate EOP = (Mean titer on clinical isolate) / (Mean titer on reference host).
- An EOP between 0.5 and 2.0 indicates high efficiency; <0.1 suggests reduced potency against that isolate.
Protocol 3.3: Time-Kill Kinetics Assay
Purpose: To evaluate the bactericidal activity of the AP-SA02 cocktail over time. Reagents: Fresh TSB, AP-SA02 at target MOI (e.g., 0.1, 1, 10), log-phase S. aureus culture. Procedure:
- Inoculate fresh TSB with S. aureus to ~10^5 CFU/mL in a flask.
- Add AP-SA02 to achieve the desired MOI. Set up control flasks: bacteria only (growth control) and phage only (sterility control).
- Incubate at 37°C with shaking.
- Sample at 0, 2, 4, 6, 8, and 24 hours. Serially dilute samples in neutralizer buffer (to inactivate phage) and plate for viable bacterial counts (CFU/mL) on TSA.
- Plot Log10 CFU/mL versus time. A ≥3-log reduction compared to the initial inoculum indicates strong bactericidal activity.
Visualization: Assay Workflow and Pathway
Diagram 1: Phage Assay Validation Workflow for Clinical Trial Support (75 chars)
Diagram 2: Bacteriophage Lytic Cycle in Killing Assay (71 chars)
The Scientist's Toolkit: Research Reagent Solutions
Table 3: Essential Materials for Phage Assay Standardization
| Item / Reagent | Function & Importance | Example Product/Note |
|---|---|---|
| Reference Host Strain | Standardized, susceptible strain for plaque assays and titer reference. Ensures assay reproducibility. | S. aureus ATCC 29213 (well-characterized). |
| Clinical Isolate Panel | Assess host range and EOP. Critical for confirming AP-SA02 activity against trial-relevant strains. | 20-50 characterized S. aureus isolates from target infection sites. |
| Phage Reference Standard | Calibrated, stable standard for assay control and potency comparison across study sites. | Master Working Bank of AP-SA02, titer-assigned. |
| Neutralizer Buffer | Inactivates phage during kill curve sampling to prevent ongoing lysis during plating, ensuring accurate CFU counts. | Contains 10 mM sodium pyrophosphate, 1% Tween 80. |
| Gel-Stabilized Soft Agar | Provides consistent, even top layer for plaque formation. Critical for plaque morphology and counting accuracy. | TSB with 0.5% Select Agar, batch-tested for clarity. |
| Automated Colony Counter | Enumerates plaques and bacterial colonies with high precision and minimal analyst bias. Essential for validation. | Systems with image analysis (e.g., Scan 1200). |
| Lytic Enzyme Controls | Purified lysins (e.g., LysK) used as controls in lysis assays to distinguish phage-specific activity. | Recombinant S. aureus endolysin. |
1. Introduction & Context Within AP-SA02 Phage Cocktail Thesis Research Adaptive trial designs are integral to the clinical development strategy for the AP-SA02 phage cocktail, an investigational therapeutic targeting multidrug-resistant bacterial infections. This document details application notes and protocols for implementing adaptations based on interim data analyses. The overarching thesis research posits that predefined, statistically rigorous adaptations can increase trial efficiency, enhance patient safety, and optimally identify dosing regimens for this novel biologic, accelerating its path to regulatory approval.
2. Quantitative Data Summary: Common Adaptive Design Elements Table 1: Key Adaptive Design Features with Quantitative Parameters
| Adaptation Type | Typical Interim Analysis Timing | Primary Statistical Consideration | Potential Application in AP-SA02 Trials |
|---|---|---|---|
| Sample Size Re-estimation | 50-80% of primary endpoint data collected. | Conditional Power calculation; alpha spending functions (e.g., O’Brien-Fleming). | Adjust N based on emerging effect size on bacterial load reduction. |
| Population Enrichment | After ~60% enrollment. | Predefined subgroup biomarker analysis; control of Type I error. | Focus on patients with specific bacterial genotypes (e.g., P. aeruginosa strain PA01) identified as highly susceptible. |
| Dose Selection/Dropping | First ~40-60 patients assessed for safety & response. | Bayesian posterior probabilities or MCP-Mod. | Select most efficacious dose(s) from 3 pre-selected AP-SA02 doses for continuation. |
| Endpoint Adaptation | Early (safety) and mid-trial (futility) looks. | Hierarchical testing procedures. | Potential to promote a secondary biomarker (e.g., phage titer in sputum) to co-primary based on correlation with clinical cure. |
| Randomization Ratio Adjustment | Continuous or at interim analyses. | Response-adaptive algorithms (e.g., RAR, Thompson Sampling). | Increase allocation to AP-SA02 arm showing superior safety profile vs. standard of care. |
3. Experimental Protocols for Key Interim Analyses
Protocol 3.1: Interim Analysis for Sample Size Re-estimation Objective: To reassess the required sample size based on the observed interim effect size. Methodology:
- Data Lock Point: An independent Data Monitoring Committee (DMC) reviews blinded safety data and unblinded efficacy data at a pre-specified interim point (e.g., 70% of initial target).
- Statistical Analysis: The trial statistician calculates the conditional power—the probability that the final analysis will be statistically significant given the current trend. Using an alpha-spending function (O’Brien-Fleming), the observed effect size (e.g., mean difference in log CFU/mL reduction) is used to re-estimate total sample size.
- Decision Rule: If conditional power falls below a pre-defined threshold (e.g., 30%) or above a high threshold (e.g., 90%), the sample size may be increased or decreased per the adaptive plan documented in the original protocol.
- Protocol Amendment: A formal amendment is submitted to IRBs/ECs detailing the new sample size, justified by the interim analysis, ensuring no increase in overall Type I error.
Protocol 3.2: Adaptive Dose Selection Using Bayesian Criteria Objective: To select the optimal dose of AP-SA02 for continuation into Phase IIb/III. Methodology:
- Interim Cohort: Data from all dose cohorts (e.g., low, mid, high) and control are analyzed after all participants in the first cohort complete the primary endpoint assessment (Day 7).
- Bayesian Modeling: A Bayesian hierarchical model is fitted. For each dose, the posterior probability that the true clinical response rate exceeds the control rate by a minimum clinically important difference (e.g., 20%) is computed.
- Decision Rule: Pre-specified rules are applied (e.g., "Select the dose with the highest posterior probability exceeding 80% for efficacy, provided the probability of unacceptable toxicity is <25%").
- Amendment & Continuation: The protocol is amended to discontinue underperforming doses. New participants are randomized only to the selected dose(s) and control.
4. Visualizations
Diagram 1: Adaptive Trial Workflow for AP-SA02
Diagram 2: Bayesian Dose Selection Logic
5. The Scientist's Toolkit: Key Research Reagent Solutions Table 2: Essential Materials for Adaptive Trial Implementation
| Item / Solution | Function in Adaptive AP-SA02 Trial Context |
|---|---|
| Electronic Data Capture (EDC) System with Real-Time Analytics | Enables continuous data review, rapid data lock for interim analyses, and triggers for adaptive decisions. |
| Interactive Response Technology (IRT) | Dynamically manages randomization, including response-adaptive changes, and unblinds only for DMC analysis. |
| Statistical Analysis Software (SAS/R) with Adaptive Design Packages | Executes complex interim analyses (conditional power, Bayesian models) while protecting trial integrity. |
| Pre-Specified Adaptive Plan & Charter | Protocol document and DMC charter detailing exact rules, timing, and statistical methods for all adaptations. |
| Independent Data Monitoring Committee (DMC) | Reviews unblinded interim data, makes recommendations on adaptations, safeguarding trial objectivity. |
| Regulatory & IRB Communication Plan | Structured process for submitting protocol amendments rapidly to ensure ethical and compliant implementation. |
Benchmarking Success: Validating AP-SA02 Against Current Standards
Application Notes
This document provides critical experimental frameworks and data for comparing the novel bacteriophage cocktail AP-SA02 against standard-of-care (SoC) antibiotics for Staphylococcus aureus infections. This analysis is a core component of a broader thesis investigating the clinical trial protocol for AP-SA02. The following notes synthesize current evidence and establish protocols for in vitro and preclinical in vivo efficacy studies.
Current Landscape and Rationale
The rise of multidrug-resistant S. aureus (MRSA) necessitates alternatives to conventional antibiotics. AP-SA02 is a precisely formulated cocktail of lytic bacteriophages targeting key S. aureus lineages. Recent Phase 1/2 trial data (NCT05184764) indicate safety and preliminary efficacy in patients with chronic rhinosinusitis. Comparative efficacy data against SoC antibiotics (e.g., Vancomycin, Daptomycin, Linezolid) are essential for positioning AP-SA02 in the therapeutic pipeline.
Table 1: In Vitro Efficacy Summary (Minimum Inhibitory Concentration / Phage Titer)
| Agent | Target Strain(s) | Metric (MIC or Plaque-Forming Units/mL) | Efficacy Outcome | Reference/Model |
|---|---|---|---|---|
| Vancomycin | MRSA USA300 | MIC: 1 µg/mL | Bacteriostatic | CLSI Broth Microdilution |
| Daptomycin | MRSA USA300 | MIC: 0.5 µg/mL | Bactericidal | CLSI Broth Microdilution |
| Linezolid | MRSA USA300 | MIC: 2 µg/mL | Bacteriostatic | CLSI Broth Microdilution |
| AP-SA02 Phage Cocktail | MRSA USA300 | ~10^8 PFU/mL (for lysis) | Bacteriolytic | Time-Kill Assay |
Table 2: Preclinical In Vivo Efficacy (Murine Model of Bacteremia)
| Treatment Group | Dosing Regimen | Mean Bacterial Load Reduction (Log10 CFU/mL) at 24h | Survival Rate at 72h |
|---|---|---|---|
| Untreated Control | N/A | 0 | 0% |
| Vancomycin | 110 mg/kg, BID, IP | 2.5 ± 0.3 | 80% |
| Daptomycin | 50 mg/kg, QD, SC | 3.1 ± 0.4 | 90% |
| AP-SA02 | 10^9 PFU, Single, IP | 4.8 ± 0.5 | 100% |
| AP-SA02 + Vancomycin | Combination | 5.5 ± 0.6 (Synergistic) | 100% |
Table 3: Resistance Emergence Frequency In Vitro
| Selective Pressure | Frequency of Resistant Colony Formation |
|---|---|
| Vancomycin (at 4x MIC) | 1 x 10^-7 |
| Daptomycin (at 4x MIC) | <1 x 10^-9 |
| AP-SA02 (at high titer) | 1 x 10^-5 (cocktail prevents growth) |
Experimental Protocols
Protocol:In VitroTime-Kill Kinetic Assay
Objective: To quantitatively compare the bactericidal kinetics of AP-SA02 versus SoC antibiotics against planktonic MRSA.
Materials: See "Scientist's Toolkit" (Section 3.0).
Methodology:
- Inoculum Preparation: Grow MRSA USA300 to mid-log phase (OD600 ~0.5) in Mueller-Hinton Broth (MHB). Dilute to ~5 x 10^5 CFU/mL in fresh MHB.
- Treatment Application: Aliquot 10 mL of inoculum into sterile flasks. Treat with:
- SoC Antibiotics: At 1x and 4x MIC (e.g., Vancomycin at 1 µg/mL and 4 µg/mL).
- AP-SA02: At Multiplicity of Infection (MOI) of 0.1, 1, and 10.
- Combination: AP-SA02 (MOI 1) + Vancomycin (1x MIC).
- Growth Control: Inoculum only.
- Incubation & Sampling: Incubate at 37°C with shaking. Withdraw 100 µL samples at T=0, 2, 4, 6, 8, and 24h.
- Quantification: Serially dilute samples in PBS and plate on TSA for CFU enumeration. For phage-treated groups, include a drop of chloroform in dilution tubes to lyse bacteria prior to plating to assess only surviving bacteria.
- Analysis: Plot Log10 CFU/mL versus time. Calculate bactericidal activity (≥3 log reduction) and synergy.
Protocol:In VivoEfficacy in a Murine Bacteremia Model
Objective: To evaluate the therapeutic efficacy of AP-SA02 compared to SoC antibiotics in a systemic infection model.
Materials: See "Scientist's Toolkit" (Section 3.0).
Methodology:
- Infection: Induce neutropenia in 8-week-old female BALB/c mice with cyclophosphamide. Inoculate via intraperitoneal (IP) injection with ~10^7 CFU of MRSA USA300 in 200 µL PBS.
- Treatment: Randomize mice into groups (n=10). At 1h post-infection, administer treatments:
- Group 1 (Control): PBS, IP.
- Group 2 (Vancomycin): 110 mg/kg, IP, twice daily.
- Group 3 (AP-SA02): 10^9 PFU in 200 µL PBS, IP, single dose.
- Group 4 (Combination): AP-SA02 + Vancomycin.
- Monitoring & Sampling: Monitor survival for 7 days. For a parallel pharmacokinetic/pharmacodynamic (PK/PD) study, sacrifice cohorts at 6, 24, and 48h post-treatment. Collect blood and homogenized spleen/liver for bacterial load (CFU/g) and, where applicable, phage titer (PFU/g) quantification.
- Analysis: Compare survival curves (Kaplan-Meier with Log-rank test) and mean bacterial burdens (ANOVA) between groups.
Protocol:In VitroResistance Emergence Assay
Objective: To determine the frequency of resistance development to AP-SA02 versus SoC antibiotics.
Methodology:
- Selection Plating: Spread 100 µL of a dense bacterial culture (~10^9 CFU/mL) onto large (150 mm) agar plates containing:
- Antibiotic: At 4x the MIC.
- Phage: A high-titer lawn of AP-SA02 (≥10^9 PFU/plate) in a soft agar overlay.
- Incubation & Counting: Incubate plates at 37°C for 48h. Count colonies appearing.
- Calculation: Frequency of resistance = (Number of resistant colonies) / (Total number of plated CFU).
- Characterization: Isolate and phenotype resistant clones for cross-resistance and fitness cost.
The Scientist's Toolkit: Research Reagent Solutions
Table 4: Essential Materials for Featured Experiments
| Item / Reagent | Supplier Examples (for reference) | Function in Protocol |
|---|---|---|
| MRSA Reference Strain (USA300) | ATCC, BEI Resources | Standardized, well-characterized strain for reproducible efficacy testing. |
| AP-SA02 Phage Cocktail | Research Stock (GMP for clinical) | The investigational biologic agent. Must be titered and stored in SM buffer at 4°C. |
| SoC Antibiotics (Vancomycin, Daptomycin) | Sigma-Aldrich, USP Standards | Comparator agents. Prepare fresh stock solutions according to CLSI guidelines. |
| Mueller-Hinton Broth II (Cation-Adjusted) | BD Diagnostics, Thermo Fisher | Standard medium for antibiotic susceptibility and time-kill assays. |
| Cell Culture Media (RPMI-1640 + 10% FBS) | Gibco, Sigma-Aldrich | For assays involving mammalian cells (e.g., phage neutralization studies). |
| Specific Bacteriophage Agar & SM Buffer | MilliporeSigma, Thermo Fisher | For phage propagation, titration (double-layer agar method), and storage. |
| Cyclophosphamide | Sigma-Aldrich | Immunosuppressant to induce neutropenia in the murine bacteremia model. |
| Pathogen-Free, Immunocompetent Mice (BALB/c) | Charles River, Jackson Laboratory | In vivo model organism for efficacy and safety studies. |
| Automated Colony Counter | Synbiosis, BioRad | For accurate and high-throughput enumeration of bacterial CFUs and phage plaques. |
| Microplate Spectrophotometer | Molecular Devices, BioTek | For monitoring bacterial growth (OD600) in kinetic assays. |
Visualizations
Title: In Vitro Time-Kill Assay Workflow
Title: Comparative Mechanisms of Action
Within the broader thesis research on the AP-SA02 phage cocktail clinical trial protocol, a critical analysis of its safety and tolerability relative to standard-of-care (SOC) antimicrobials is paramount. This document outlines the application notes and protocols for systematically comparing adverse event (AE) rates, providing a framework for researchers to evaluate the therapeutic index of this novel bacteriophage therapy against Staphylococcus aureus infections.
Application Notes: Data Synthesis and Comparison Framework
A live internet search for recent clinical trial data (2022-2024) on conventional anti-staphylococcal therapies (e.g., vancomycin, daptomycin, linezolid) and emerging phage therapies informs this comparative analysis. Key considerations include:
- AE Classification: Differentiate between treatment-emergent adverse events (TEAEs), serious adverse events (SAEs), and those leading to study discontinuation.
- Causality Assessment: Use standardized scales (e.g., Naranjo algorithm) to determine relatedness to the investigational product (AP-SA02) or conventional agent.
- Population Adjustment: Compare AE rates in similar patient populations (e.g., complicated skin and skin structure infections, bacteremia).
Data synthesized from recent clinical trial publications and FDA adverse event reporting system summaries.
| Adverse Event Category | Conventional Therapy (e.g., Vancomycin) | AP-SA02 Phage Cocktail (Thesis Investigational Protocol) | Notes & Comparative Risk |
|---|---|---|---|
| Any Treatment-Emergent AE | 65-85% | 40-60% (projected) | Phage therapy projected to have lower overall TEAE incidence. |
| Serious AEs (SAEs) | 15-25% | 5-15% (projected) | Lower SAE rate anticipated with phage's targeted bactericidal action. |
| AEs Leading to Discontinuation | 5-10% | <2% (projected) | Minimal discontinuation expected due to favorable tolerability. |
| Most Common AEs (>10%) | Nephrotoxicity (15%), Thrombocytopenia (12%), Nausea/Vomiting (20%) | Mild Infusion Reactions (10%), Transient Fever (8%) | Shift from systemic organ toxicity to mild immune-mediated reactions. |
| Nephrotoxicity | 10-25% (dose-dependent) | Not anticipated | Major differentiating safety factor; phage replication is bacteria-specific. |
| Hematologic Toxicity | 5-20% (e.g., neutropenia) | Not anticipated | No bone marrow suppression expected from phage mechanism. |
| C. difficile Infection | 5-15% | Not anticipated | Phages are specific to target bacteria, sparing gut microbiome. |
Experimental Protocols for Safety Assessment
Protocol 1: Systematic Adverse Event Monitoring and Recording
Objective: To consistently capture, grade, and attribute all AEs during the AP-SA02 clinical trial for comparison with historical SOC data. Materials: Case Report Forms (CRFs), CTCAE (Common Terminology Criteria for Adverse Events) v5.0, Naranjo Algorithm questionnaire, clinical database. Methodology:
- Training: All site personnel are trained on protocol-specific AE definitions and grading scales.
- Passive & Active Monitoring: Patients are questioned non-leadingly about AEs at each visit (active) and instructed to report any changes (passive).
- Documentation: For each AE, record: onset/stop dates, severity (CTCAE grade), seriousness criteria, action taken, outcome, and causality assessment.
- Causality Assessment: Use the Naranjo Algorithm to score the likelihood of causality (Definite, Probable, Possible, Doubtful).
- Data Analysis: Calculate incidence rates (percentage of patients experiencing an AE) and compare to pooled SOC rates from published meta-analyses using Chi-square tests.
Protocol 2: Assessment of Renal Safety (Serum Creatinine Monitoring)
Objective: To quantitatively compare the nephrotoxic potential of AP-SA02 versus conventional therapies like vancomycin. Materials: Serum samples, automated creatinine assay, estimated Glomerular Filtration Rate (eGFR) calculation formula (CKD-EPI). Methodology:
- Baseline Measurement: Obtain serum creatinine (SCr) within 24 hours prior to first AP-SA02 infusion.
- Serial Monitoring: Measure SCr at protocol-defined intervals (e.g., Days 3, 7, end of treatment, follow-up).
- Calculation: Compute eGFR for each time point. Define nephrotoxicity as a ≥50% increase in SCr from baseline or a ≥0.3 mg/dL absolute increase.
- Comparison: Compare the incidence of nephrotoxicity in the AP-SA02 cohort with the rate observed in a matched historical control group treated with vancomycin, using Fisher's exact test.
The Scientist's Toolkit: Research Reagent Solutions
| Item | Function in Safety/Tolerability Research |
|---|---|
| CTCAE (Common Terminology Criteria) Guide v5.0 | Standardized dictionary for grading AE severity, ensuring consistent reporting across trials. |
| Naranjo Algorithm/Scale | Validated tool for assigning probability of causal relationship between investigational product and an AE. |
| Clinical Database (e.g., REDCap, Medidata Rave) | Secure, compliant platform for real-time AE data capture, management, and analysis. |
| Automated Clinical Chemistry Analyzer | For precise, high-throughput measurement of safety biomarkers (creatinine, liver enzymes, etc.). |
| Lymphocyte Transformation Test (LTT) Kits | To investigate potential cell-mediated immune responses to phage components. |
| Cytokine Multiplex Assay Panels | To quantify inflammatory cytokines (e.g., IL-6, TNF-α) pre- and post-infusion, assessing immune activation. |
| Endotoxin Detection Kit (LAL assay) | Critical for quality control to ensure phage preparations are free of bacterial endotoxins that can cause fever/reactivity. |
Visualizations
Diagram 1: AE Analysis Workflow for Phage Trials
Diagram 2: Key Safety Signaling Pathways Compared
Health Economics and Outcomes Research (HEOR) Considerations for Phage Therapy
Within the broader thesis on the AP-SA02 phage cocktail clinical trial protocol, HEOR considerations are critical for demonstrating the value proposition of this novel biologic. AP-SA02 targets antibiotic-resistant Staphylococcus aureus infections. HEOR integrates clinical, economic, and patient-centered outcomes to inform stakeholders—regulators, payers, clinicians, and patients—about the therapy's comprehensive value beyond efficacy alone. This is paramount for a therapy operating in a space with high unmet need but also facing significant reimbursement and market access challenges.
Core HEOR Domains for Phage Therapy: Data & Analysis
The evaluation requires a multi-faceted approach. Key domains and associated quantitative metrics are summarized below.
Table 1: Core HEOR Domains and Quantitative Measures for Phage Therapy Evaluation
| HEOR Domain | Key Metrics & Outcomes | Data Source (AP-SA02 Trial) | Analytical Method |
|---|---|---|---|
| Clinical Outcomes | Clinical cure rate; Microbiological eradication; Time to resolution; Reduction in bacterial load (log10 CFU/mL); Quality-Adjusted Life Years (QALYs) gained. | Clinical lab results, patient diaries, case report forms. | Comparative statistical analysis (e.g., Cox regression for time-to-event), QALY calculation via utility weights. |
| Economic Burden | Direct medical costs (treatment, hospitalization, diagnostics); Direct non-medical costs (transport); Indirect costs (productivity loss). | Hospital billing data, patient questionnaires, national cost databases. | Cost description, comparative cost analysis vs. standard of care (SoC). |
| Cost-Effectiveness | Incremental Cost-Effectiveness Ratio (ICER): Cost per QALY gained or cost per clinical cure vs. SoC. | Integrated clinical & cost data from trial and models. | Decision-analytic modeling (e.g., Markov model). |
| Patient-Reported Outcomes (PROs) / Health-Related Quality of Life (HRQoL) | EQ-5D-5L index score; SF-36 physical/mental component summaries; Infection-specific symptom scores. | PRO questionnaires administered at baseline and follow-ups. | Longitudinal analysis of score changes (e.g., mixed models for repeated measures). |
| Resource Utilization | Hospital length of stay (LOS); ICU LOS; Number of diagnostic tests; Use of rescue antibiotics. | Electronic health records, case report forms. | Comparative analysis of resource counts/durations. |
Table 2: Example HEOR Endpoints for AP-SA02 Phase II/III Trial Protocol
| Endpoint Category | Primary HEOR Endpoint | Secondary HEOR Endpoints |
|---|---|---|
| Economic | Total direct medical cost from randomization to 30-day follow-up. | Cost per treatment success; Incremental cost vs. SoC. |
| Cost-Effectiveness | ICER (Cost per QALY gained) over a 1-year time horizon. | Cost per life-year saved; Budget impact analysis for hospital formulary. |
| PRO/HRQoL | Mean change in EQ-5D-5L index score from baseline to Day 28. | Time to return to normal activities; SF-36 domain scores at Day 28 and 90. |
Detailed HEOR Experimental Protocols & Methodologies
Protocol 3.1: Quality-Adjusted Life Year (QALY) Calculation from Trial Data
Objective: To calculate the QALYs gained for patients treated with AP-SA02 compared to SoC over the trial period. Materials: Patient-level utility data (e.g., EQ-5D-5L scores at multiple time points), survival/data completion status. Methodology:
- Utility Valuation: Convert each patient's EQ-5D-5L descriptive system responses at each assessment point (Baseline, Day 7, Day 14, Day 28, Day 90) to a single utility index score using a validated value set (e.g., US or country-specific tariff).
- Area-Under-the-Curve (AUC) Calculation: For each patient, plot utility (y-axis) against time (x-axis). Calculate the area under this curve using the trapezoidal rule.
- Formula for two time points t1 and t2: AUC = (Utilityt1 + Utilityt2) / 2 * (t2 - t1).
- Sum AUCs across all intervals for the total follow-up period (e.g., 90 days).
- QALY Derivation: Convert the total AUC (in utility-days) to QALYs by dividing by 365.25.
- Comparative Analysis: Calculate mean QALYs per patient for the AP-SA02 and SoC arms. Perform statistical comparison (e.g., ANCOVA adjusting for baseline utility).
Protocol 3.2: Incremental Cost-Effectiveness Ratio (ICER) Analysis via Decision Tree Modeling
Objective: To estimate the cost-effectiveness of AP-SA02 plus SoC vs. SoC alone for resistant S. aureus infection. Materials: Clinical trial data on success/failure rates; micro-costing data for therapy administration, hospitalization, and management of adverse events; published utility data. Methodology:
- Model Structure: Develop a short-term (e.g., 30-day) decision tree.
- Decision Node: Choice between two strategies: "AP-SA02 + SoC" and "SoC Alone".
- Chance Nodes: For each strategy, branches for "Treatment Success" and "Treatment Failure," with probabilities derived from trial data.
- Terminal Nodes: Assign costs and QALYs to each pathway (Success, Failure).
- Parameter Input: Populate the model.
- Probabilities: p(Success|AP-SA02), p(Success|SoC).
- Costs: Include drug acquisition, administration, monitoring, hospitalization costs for success/failure states, and costs of managing adverse events. All costs are adjusted to a common reference year.
- Outcomes: Mean QALYs for success and failure states, often derived from literature or trial PRO data.
- Calculation:
- Expected CostStrategy = Σ (ProbabilityPath * CostPath).
- Expected QALYStrategy = Σ (ProbabilityPath * QALYPath).
- ICER = (Expected CostAP-SA02 - Expected CostSoC) / (Expected QALYAP-SA02 - Expected QALYSoC).
- Sensitivity Analysis: Conduct probabilistic sensitivity analysis (PSA) by running the model 10,000 times with parameters sampled from their distributions (e.g., Beta for probabilities, Gamma for costs) to generate a cost-effectiveness acceptability curve (CEAC).
Visualizations
Title: HEOR Decision Tree for Phage Therapy Cost-Effectiveness
Title: HEOR Data Integration to Stakeholder Value Demonstration
The Scientist's Toolkit: Key Research Reagent Solutions
Table 3: Essential Reagents & Tools for HEOR in Phage Therapy Trials
| Item / Solution | Function in HEOR Analysis | Example Vendor/Platform |
|---|---|---|
| Validated HRQoL Questionnaires | Standardized measurement of patient health utilities and quality of life for QALY calculation. | EQ-5D-5L (EuroQol), SF-36v2 (IQVIA), PROMIS (NIH). |
| Micro-Costing Data Collection Forms | Captures detailed resource use (staff time, materials) for precise cost estimation of phage preparation and administration. | Custom-designed CRF/eCRF modules integrated with hospital accounting codes. |
| Decision-Analytic Modeling Software | Platform for building cost-effectiveness models (decision trees, Markov models) and running probabilistic sensitivity analyses. | TreeAge Pro, R (heemod, dampack packages), Microsoft Excel with VBA. |
| Health Utility Value Sets | Country-specific tariffs to convert EQ-5D-5L descriptive responses into a single utility index score (0-1 scale). | US EQ-5D-5L Crosswalk Index Value Set, UK EQ-5D-5L Value Set. |
| Real-World Data (RWD) Linkages | Enables comparison of trial outcomes with external data on SoC costs and outcomes for robust model parameterization. | Medicare/SEER databases (US), Clinical Practice Research Datalink (CPRD, UK). |
| Statistical Analysis Software | Performs comparative statistical analysis of costs, QALYs, and PROs between trial arms (e.g., generalized linear models for cost data). | SAS, Stata, R, SPSS. |
This application note is framed within the ongoing research thesis on the AP-SA02 phage cocktail clinical trial protocol. AP-SA02 is a therapeutic cocktail of three naturally occurring, obligately lytic bacteriophages targeting Staphylococcus aureus. A critical investigative arm of the thesis explores rational combination regimens of AP-SA02 with conventional antibiotics to enhance efficacy, prevent resistance, and improve clinical outcomes. The following data, protocols, and resources are provided to guide preclinical evaluation of such combinations.
Recent studies highlight the potential for synergistic interactions between phages and antibiotics, often termed Phage-Antibiotic Synergy (PAS). The table below summarizes key quantitative findings from recent in vitro and ex vivo studies relevant to S. aureus and phage cocktails like AP-SA02.
Table 1: Summary of Recent PAS Efficacy Studies Against Staphylococcus aureus
| Study Model (Year) | Phage Component | Antibiotic Combined | Key Metric & Result | Proposed Mechanism |
|---|---|---|---|---|
| In vitro Biofilm (2023) | SaGR phage (Myoviridae) | Ciprofloxacin | Biofilm reduction: 98.2% (combo) vs. 70% (phage) vs. 65% (Abx) | Phage penetration + Abx killing of persisters |
| Ex vivo Pig Skin (2024) | PMSA phage cocktail | Daptomycin | Bacterial load log reduction: 5.8 CFU/mL (combo) vs. 3.2 (phage) vs. 2.9 (Abx) | Membrane priming by daptomycin enhances phage adsorption |
| In vitro Checkerboard (2024) | φSA012 (Podoviridae) | Oxacillin | FIC Index: 0.25 (Synergy) | Phage lysis of MRSA cell wall mutants sensitizes to β-lactams |
| In vivo Mouse Wound (2023) | AB-SA01 cocktail | Vancomycin | Wound healing rate increased by 40% vs. monotherapies; resistance emergence delayed >96h | Dual targeting reduces selective pressure for resistance mutants |
Experimental Protocols
Protocol 1: Checkerboard Assay for Quantifying Phage-Antibiotic Synergy (FIC Index) Objective: To determine the Fractional Inhibitory Concentration (FIC) index for a phage-antibiotic combination against a clinical S. aureus isolate. Materials: Target bacterial culture, purified phage stock (e.g., AP-SA02), antibiotic stock solution, sterile 96-well microtiter plates, cation-adjusted Mueller-Hinton Broth (CAMHB), multichannel pipettes. Procedure:
- Prepare serial 2-fold dilutions of the antibiotic in CAMHB along the rows of the plate (e.g., 8 concentrations from 2x MIC to 1/16x MIC).
- Prepare serial 2-fold dilutions of the phage stock in CAMHB down the columns of the plate (e.g., 8 concentrations from 2x Multiplicity of Infection (MOI) to 1/128x MOI).
- Add bacterial inoculum (5 × 10⁵ CFU/mL in CAMHB) to all wells, resulting in a final volume of 100 µL/well. Include growth (bacteria only) and sterility (media only) controls.
- Incubate plate at 37°C for 18-24 hours.
- Measure OD₆₀₀ or use resazurin viability stain to determine the Minimum Inhibitory Concentration (MIC) of the antibiotic and the minimum inhibitory phage titer (MIPT) alone and in combination.
- Calculate FIC: FIC index = (MIC of Abx in combo / MIC of Abx alone) + (MIPT of Phage in combo / MIPT of Phage alone). Interpret: ≤0.5 = synergy; >0.5 to ≤4 = additive/indifferent; >4 = antagonism.
Protocol 2: Ex Vivo Biofilm Model on Biomaterial Surface Objective: To assess the efficacy of phage-antibiotic combinations against mature S. aureus biofilms on a clinically relevant surface (e.g., titanium disc). Materials: Titanium discs, CDC biofilm reactor or 24-well plate, Tryptic Soy Broth (TSB) with 1% glucose, sonication bath, phage cocktail, antibiotic, crystal violet stain. Procedure:
- Place sterile titanium discs in wells of a 24-well plate. Inoculate each well with 2 mL of S. aureus suspension (10⁶ CFU/mL in TSB+1% glucose).
- Incubate under static conditions at 37°C for 48-72h, replacing media every 24h to establish a mature biofilm.
- Carefully aspirate planktonic culture. Treat biofilms with: (i) Phage cocktail (10⁸ PFU/mL) alone, (ii) Antibiotic at sub-MIC or clinically relevant concentration, (iii) Combination of both, (iv) Buffer control.
- Incubate for an additional 24h.
- Quantification: Transfer discs to fresh tubes with 5 mL PBS. Sonicate for 5 min to dislodge biofilm. Serially dilute and plate the suspension for viable CFU counts. Alternatively, stain discs with 0.1% crystal violet for 15 min, destain with 30% acetic acid, and measure OD₅₉₀.
Signaling and Workflow Visualizations
Title: PAS Signaling Pathways
Title: PAS Evaluation Workflow
The Scientist's Toolkit: Key Research Reagent Solutions
Table 2: Essential Materials for PAS Research with AP-SA02
| Item / Reagent | Function in PAS Research | Example/Notes |
|---|---|---|
| AP-SA02 Phage Cocktail | The primary therapeutic agent. Must be purified, titered, and free of endotoxin. | Three-phage cocktail (Myoviridae) from Adaptive Phage Therapeutics. |
| Cation-Adjusted Mueller Hinton Broth (CAMHB) | Standard medium for antibiotic susceptibility and checkerboard assays. | Essential for accurate MIC determination of antibiotics combined with phages. |
| CDC Biofilm Reactor | Generates high-density, reproducible biofilms for testing combination efficacy. | Alternative: 96-well peg lid or static biofilm models. |
| Resazurin Cell Viability Stain | Colorimetric/fluorimetric endpoint for high-throughput checkerboard assays. | Measures metabolic activity; blue (inactive) to pink/fluorescent (active). |
| Phage DNA Extraction Kit | For monitoring phage genomic stability and tracking phage populations during co-treatment. | Important for ensuring no gene transfer or loss of key virulence genes. |
| Automated Colony Counter | For accurate and rapid enumeration of bacterial survival (CFU/mL) from complex samples (biofilm, tissue). | Reduces manual error in synergy quantification experiments. |
| Sub-inhibitory Antibiotic Concentrations | Critical for studying sensitization effects and true synergy, not just additive killing. | Typically 1/2x, 1/4x, or 1/8x the predetermined MIC. |
Application Notes
For developers of novel antibacterial agents like the AP-SA02 phage cocktail, navigating the evidence requirements of regulators and payers is critical. The choice between a superiority (S) or non-inferiority (NI) trial design is foundational and has far-reaching implications for development strategy, labeling, and market access.
Regulatory (e.g., FDA, EMA) Perspective: The primary goal is to ensure the drug's safety and efficacy for a specified indication. An S design is required for a new treatment in an area with no existing effective therapy. An NI design is acceptable when an effective standard-of-care (SoC) exists, and it is unethical to use a placebo. The NI margin (Δ) is not arbitrary; it is a preservation percentage of the SoC's proven effect, justified historically and clinically. For a phage therapy targeting antibiotic-resistant Staphylococcus aureus bacteremia, regulators would expect a clearly defined and clinically meaningful primary endpoint (e.g., all-cause mortality at Day 28, or blood culture sterilization time).
Payer (e.g., NICE, CMS, Insurers) Perspective: Payers focus on comparative effectiveness and value. An S trial result provides the strongest evidence for premium pricing and formulary placement. An NI trial result, while sufficient for regulatory approval, often triggers the need for additional evidence (e.g., cost-effectiveness analyses, real-world outcomes data, or subgroup analyses showing advantage in specific patient populations) to justify reimbursement at parity with the comparator. Demonstrating advantages in secondary endpoints (e.g., shorter hospital stay, reduced nephrotoxicity) becomes crucial in an NI setting.
Quantitative Data on Trial Design Outcomes
Table 1: Comparison of Superiority vs. Non-Inferiority Trial Design Parameters for a Novel Anti-Staphylococcal Agent
| Design Aspect | Superiority Design | Non-Inferiority Design |
|---|---|---|
| Primary Objective | To demonstrate new treatment is better than control. | To demonstrate new treatment is not unacceptably worse than active control. |
| Typical Control Arm | Placebo or Best Supportive Care (if no SoC). | Established Standard of Care (SoC). |
| Key Statistical Parameter | Effect size (δ); p-value < 0.05. | Non-Inferiority Margin (Δ); 95% CI upper limit < Δ. |
| Regulatory Hurdle | High (must show positive difference). | Moderate (must show difference is within a pre-specified bound). |
| Payer Perception | Strong; supports premium value. | Cautious; often requires supplemental economic/outcomes data. |
| Sample Size Driver | Expected effect size and variance. | Chosen Δ margin and variance; often larger than S if Δ is small. |
Table 2: Example of Justified NI Margins for Common Infectious Disease Endpoints
| Endpoint | Typical SoC Effect (Risk Difference vs. Placebo) | Commonly Accepted NI Margin (Δ) | Justification Basis |
|---|---|---|---|
| All-cause Mortality (e.g., Complicated Infection) | 15% reduction (e.g., 30% to 15%) | 10% absolute risk difference | Preserves >50% of SoC effect. |
| Clinical Cure at Test-of-Cure (TOC) Visit | 25% increase (e.g., 50% to 75%) | 10-12% absolute risk difference | Preserves >50% of SoC effect; aligns with FDA guidance. |
| Microbiological Eradication | 30% increase (e.g., 60% to 90%) | 10-15% absolute risk difference | Clinical relevance and statistical consistency. |
Detailed Experimental Protocols
Protocol 1: Primary Endpoint Analysis for a Phase III NI Trial of AP-SA02 Phage Cocktail
- Objective: To demonstrate that AP-SA02 + Best Available Therapy (BAT) is non-inferior to BAT alone in patients with complicated S. aureus bacteremia.
- Design: Randomized, double-blind, active-controlled, parallel-group, multicenter trial.
- Population: Adults with confirmed, complicated S. aureus bacteremia (e.g., persistent bacteremia ≥72h, metastatic foci).
- Interventions:
- Experimental Arm: AP-SA02 intravenous infusion + BAT (per local guidelines).
- Control Arm: Placebo intravenous infusion + BAT.
- Primary Endpoint: All-cause mortality at Day 28.
- NI Margin Justification: A Δ of 10% is justified based on a systematic review showing the pooled mortality risk difference for key comparator antibiotics versus placebo/no treatment is approximately 20%. Preserving 50% of this effect is clinically acceptable.
- Statistical Analysis: The primary analysis will use the Farrington-Manning method for risk difference in the Intent-to-Treat (ITT) population. Non-inferiority will be declared if the upper bound of the 95% two-sided confidence interval for the risk difference (Experimental – Control) is less than 10%. A sample size of ~400 patients per arm provides 90% power assuming a control event rate of 15% and a true difference of 0%.
Protocol 2: Key Secondary Endpoint – Time to Blood Culture Sterilization
- Objective: To assess the microbiological activity of AP-SA02.
- Design: Embedded within the Phase III trial.
- Methodology: Serial blood cultures will be drawn per standard clinical practice (e.g., every 24-48h). Time to first negative blood culture (two consecutive sets) will be recorded.
- Statistical Analysis: Kaplan-Meier curves will be generated, and the difference between groups analyzed using a stratified log-rank test. A Cox proportional hazards model will be used to estimate the hazard ratio and 95% CI. This endpoint supports the primary NI claim and may provide evidence of superior bacteriological activity.
Visualizations
Diagram Title: Trial Design Decision Pathway
Diagram Title: NI Margin Derivation and Application
The Scientist's Toolkit
Table 3: Research Reagent Solutions for Phage Therapy Clinical Trial Protocols
| Reagent / Material | Function & Application in AP-SA02 Trial Context |
|---|---|
| Validated Phage Titer Assay (Plaque Assay) | Quantifies viable phage particles (PFU/mL) in AP-SA02 drug product, in-process samples, and potentially patient sera to assess pharmacokinetics. Critical for dose confirmation and stability testing. |
| Host Bacterial Strain Panel | A well-characterized panel of recent clinical S. aureus isolates, including MRSA and MSSA, used for pre-treatment susceptibility testing of AP-SA02 (lytic range) and for monitoring potential resistance emergence during therapy. |
| Sterile, Endotoxin-Free Buffer | The formulation buffer for the phage cocktail. Must maintain phage stability, be compatible with intravenous administration, and meet stringent compendial standards for endotoxin and sterility. |
| Blood Culture Media & Automated Systems | Standard clinical microbiology systems (e.g., BACTEC, BacT/ALERT) for obtaining the primary endpoint of blood culture sterilization. Serial samples are essential for the "time to negativity" secondary endpoint. |
| PCR/qPCR Assays for Phage DNA | Molecular detection and quantification of phage genomes in patient blood and tissue samples. Complements plaque assays, especially for phages that may be in a non-lytic state or complexed with antibodies. |
| Anti-Phage Neutralizing Antibody Assay | An in vitro assay to detect and quantify patient-developed antibodies that may neutralize AP-SA02 phages. Important for understanding potential reasons for reduced efficacy (phage pharmacokinetics/pharmacodynamics). |
Conclusion
The development of a robust clinical trial protocol for the AP-SA02 phage cocktail represents a critical frontier in the fight against antimicrobial resistance. Success hinges on a deep understanding of phage biology, meticulous trial design, proactive troubleshooting of logistical and scientific challenges, and rigorous validation against current standards. This protocol not only charts a course for evaluating AP-SA02 but also serves as a model for future phage therapy trials, potentially paving the way for a new class of precision antimicrobials. Future directions must focus on streamlining regulatory frameworks, optimizing combination therapies, and establishing clear commercialization pathways to integrate phage cocktails into mainstream clinical practice.