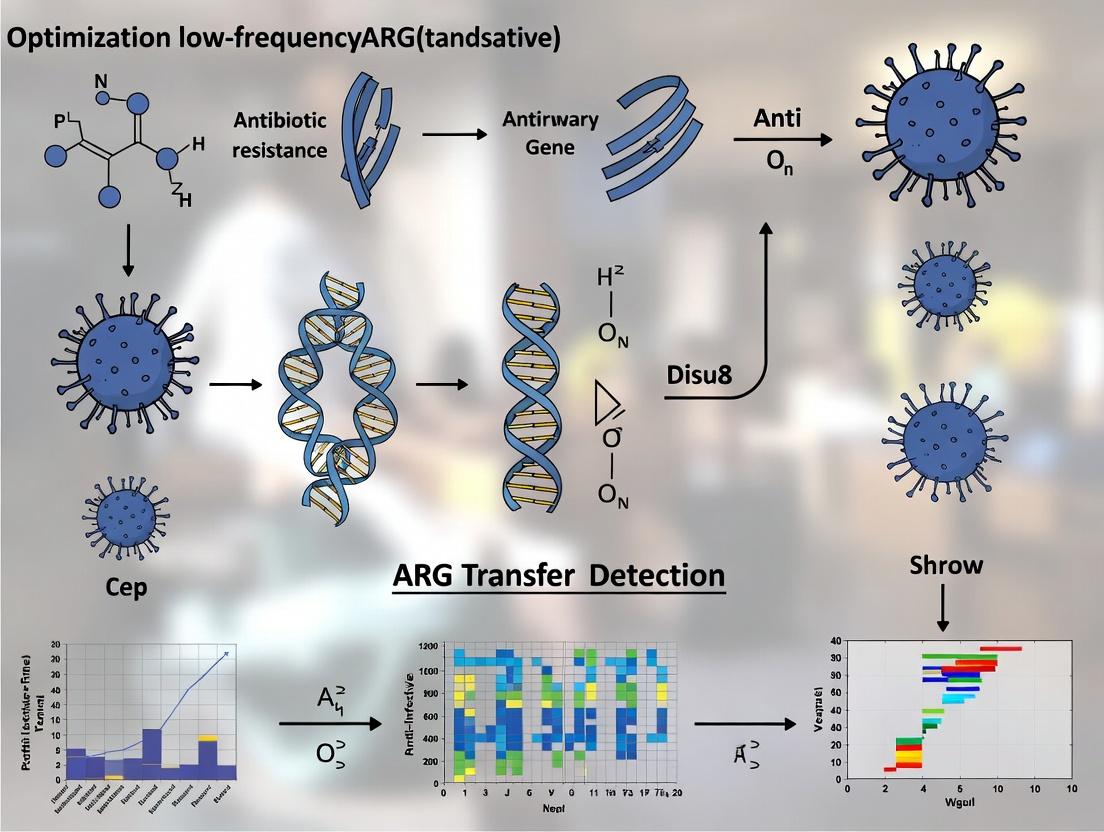
Advanced Strategies for Detecting Low-Frequency Antibiotic Resistance Gene Transfer: Methods and Validation
This article provides a comprehensive guide for researchers and drug development professionals on optimizing the detection of low-frequency antibiotic resistance gene (ARG) transfer.
Advanced Strategies for Detecting Low-Frequency Antibiotic Resistance Gene Transfer: Methods and Validation
Abstract
This article provides a comprehensive guide for researchers and drug development professionals on optimizing the detection of low-frequency antibiotic resistance gene (ARG) transfer. We explore the foundational importance of rare transfer events in resistance evolution and clinical failure. We detail cutting-edge methodological approaches, from high-throughput sequencing to advanced culture techniques, and provide troubleshooting protocols to overcome common sensitivity limitations. Finally, we present a framework for validating and comparing detection assays to ensure reliability and reproducibility in research and preclinical development, addressing a critical bottleneck in antimicrobial resistance surveillance and drug discovery.
Understanding the Critical Role of Low-Frequency ARG Transfer in AMR Evolution
Technical Support Center: Troubleshooting Low-Frequency ARG Transfer Detection
FAQs & Troubleshooting Guides
Q1: Our control samples (no-donor) are showing positive signals in the culture-based enrichment assay, leading to high background. What could be the cause? A: This indicates contamination or carryover. Recommended steps:
- Decontaminate Workspace: Perform UV decontamination of biosafety cabinets for 30 minutes before and after use.
- Review Aseptic Technique: Use separate workspaces for pre- and post-enrichment steps. Change gloves frequently.
- Include Rigorous Controls: Implement a minimum of three negative controls: (a) Recipient-only culture, (b) Donor-only culture, (c) Sterile media incubated alongside experiment.
- Validate Reagents: Test all growth media and selective antibiotics for sterility by incubating an aliquot separately.
Q2: After performing a conjugation assay and plating on selective agar, we observe no transconjugant colonies. What should we check? A: Follow this systematic checklist:
| Issue Category | Specific Check | Action |
|---|---|---|
| Cell Viability | Donor and recipient cell counts pre-mating. | Ensure cultures are in mid-log phase (OD600 ~0.4-0.6). Use live/dead staining. |
| Selective Antibiotics | Antibiotic concentration and stability. | Verify MIC for recipient strain. Prepare fresh antibiotic stocks. Confirm selective plates are within shelf life. |
| Mating Conditions | Mating time, temperature, and ratio. | Extend mating time (e.g., from 2h to 18h). Optimize donor:recipient ratio (e.g., test 1:1, 1:10). Ensure correct growth medium (often LB). |
| Plating Technique | Volume plated and recovery phase. | Plate a larger volume (up to 200 µL) of the mating mixture and its dilutions. Include a non-selective "input control" plate to quantify total cells. |
Q3: qPCR/ddPCR results for plasmid copy number in transconjugants are inconsistent between technical replicates. How can we improve accuracy? A: Inconsistency often stems from template quality or PCR inhibition.
- Purification Protocol: Use a column-based plasmid purification kit designed for low-copy plasmids, followed by an additional ethanol precipitation and wash step to remove inhibitors.
- DNA Quantification: Quantify DNA using a fluorometric method (e.g., Qubit) rather than Nanodrop for accuracy.
- Inhibition Test: Perform a standard curve with spiked control DNA into your sample eluent to check for PCR inhibition.
- ddPCR Preference: For absolute quantification of low-frequency targets, switch to droplet digital PCR (ddPCR) as it is less susceptible to amplification efficiency variations.
Q4: When using fluorescence-activated cell sorting (FACS) to isolate transconjugants, the sorted population shows low purity or viability. How do we optimize? A: This is common when sorting rare events (<0.001%).
- Gating Strategy: Use a stringent, sequential gating strategy: (1) FSC-A/SSC-A to exclude debris, (2) FSC-H/FSC-W to select single cells, (3) Apply a conservative gate based on fluorescence from the unmixed donor and recipient controls.
- Collection Medium: Collect sorted cells into recovery medium (e.g., SOC medium with 10% glycerol) in a low-bind tube. Keep samples on ice.
- Validation: Immediately plate an aliquot of the sorted sample on selective and non-selective agar to calculate purity and viability post-sort.
Key Experimental Protocols
Protocol 1: Solid-Phase Mating Assay for Low-Frequency Conjugation
- Purpose: To detect and quantify ARG transfer events occurring at frequencies below 10⁻⁶.
- Method:
- Grow donor (D; carrying plasmid) and recipient (R; plasmid-free, antibiotic resistant) to mid-log phase.
- Mix at a 1:10 (D:R) ratio. Pellet cells (5,000 x g, 2 min).
- Resuspend in 100 µL fresh, non-selective broth.
- Spot the entire mixture onto a pre-warmed, non-selective agar plate. Let it absorb.
- Incubate upright at 37°C for 18 hours (extended mating).
- Harvest the entire cell mass by scraping with 1 mL of saline.
- Serially dilute (10-fold) and plate 100 µL volumes onto: a) Donor-selective agar (counts donor), b) Recipient-selective agar (counts recipient), c) Double-selective agar (counts transconjugants, T).
- Incubate plates for 24-48 hours.
- Calculation: Transfer Frequency = (T / R) or (T / D). Report both.
Protocol 2: Enrichment-PCR Protocol for Rare Transconjugant Detection
- Purpose: To detect transfer events below the limit of direct plating (<10 CFU/mL).
- Method:
- Perform mating as in Protocol 1, steps 1-6.
- Instead of direct plating, resuspend the harvested cell mix in 10 mL of broth containing antibiotic that selects only for the transconjugant (e.g., counters recipient and donor).
- Incubate with shaking for 24-48h to enrich for any transconjugants present.
- Extract total DNA from the enrichment culture using a microbial DNA kit.
- Perform ddPCR targeting both a plasmid-specific gene (e.g., blaₜₑₓ₋ₘ) and a chromosomal control from the recipient (e.g., a housekeeping gene). Use primer/probe sets with distinct fluorophores.
- Analysis: A positive ddPCR signal for the plasmid target in the enrichment culture, normalized to the recipient chromosomal signal, confirms a transfer event occurred in the initial mating.
Research Reagent Solutions Toolkit
| Item | Function in Low-Frequency Transfer Experiments |
|---|---|
| Synth. Stool Microbial Communities | Defined, reproducible recipient backgrounds for in vitro conjugation studies, reducing variable biotic factors. |
| Fluorescent Protein-Encoding Plasmids | Tags donor/recipient/transconjugant populations for visualization and FACS sorting (e.g., GFP, RFP, BFP). |
| Chromosomal Labeling Antibiotics | Stable, low-fitness-cost antibiotics (e.g., rifampicin, nalidixic acid) to selectively count recipient populations. |
| ddPCR Supermix (for probes) | Enables absolute, sensitive quantification of plasmid and chromosome targets without a standard curve. |
| Membrane Filter (0.22µm) | For filter mating assays; provides close cell contact on a solid surface without nutrient limitation. |
| Mobilizable/Non-Mobilizable Control Plasmids | Positive and negative controls to validate conjugation machinery functionality. |
Visualizations
Title: Dual-Path Workflow for Detecting Low-Frequency ARG Transfer
Title: Troubleshooting Logic Tree for Failed Conjugation Assay
Troubleshooting Guides & FAQs
Q1: In conjugation assays, we fail to detect transconjugants even with extensive antibiotic selection. What could be causing this, and how can we optimize sensitivity? A: This is often due to sub-detection limit transfer frequencies or recipient cell overgrowth masking rare events.
- Troubleshooting Steps:
- Increase Input Donor: Use a higher donor-to-recipient ratio (e.g., 1:1 instead of 1:10) in mating assays to increase absolute event numbers.
- Suppress Recipient Growth: Incorporate bacteriostatic antibiotics that inhibit the recipient's growth (but not kill, which could release inhibitory compounds) without affecting the donor or the selected transconjugant.
- Extended Enrichment: Post-mating, incubate the cell mixture in non-selective rich medium for 4-6 hours before plating on selective media to allow expression of acquired resistance genes.
- Use Fluorescent Markers: Employ donors/recipients with chromosomally integrated fluorescent proteins (e.g., GFP, RFP). Use flow cytometry with cell sorting (FACS) to physically isolate and enrich potential transconjugants before plating, increasing detection sensitivity by 100-1000 fold.
Q2: For natural transformation, our environmental DNA (eDNA) extracts yield no transformants. Are we losing the low-concentration, transfer-competent DNA? A: Yes, degradation and competition are key issues.
- Troubleshooting Steps:
- DNA Protection: Add DNA-stabilizing agents (e.g., EDTA, polyamines) to eDNA extraction buffers to inhibit nucleases.
- Competitor DNA: Include carrier DNA (e.g., salmon sperm DNA) during transformation to saturate non-specific DNA-binding sites and nucleases, protecting the rare ARG-containing fragments.
- Concentrate DNA: Use high-volume ethanol precipitations or centrifugal concentrators to process large volumes of environmental sample, concentrating the DNA from liters to microliters.
- Induce Competence: For known transformable species, add synthetic competence-stimulating peptides (CSP) to the assay to maximize the fraction of competent cells.
Q3: In transduction experiments, phage lysates prepared from environmental isolates show no transductants. How can we ensure we capture rare, generalized transducing particles? A: The signal is lost in the noise of non-transducing phage and inhibitors.
- Troubleshooting Steps:
- Mitigate Inhibition: Treat lysates with DNase I to eliminate free extracellular DNA (mimicking transformation). Use RNase A as a control.
- Enrich Transducing Particles: Pre-incubate the phage lysate with magnetic beads coated with antibodies specific to the target recipient strain. This panning method enriches for phage that can adsorb to the recipient, which includes transducing particles.
- High MOI Infection: Concentrate phage lysates by ultracentrifugation or PEG precipitation to achieve a high Multiplicity of Infection (MOI >10) to increase the chance of a rare transducing particle encountering a host.
- Avoid Plaque-Forming Units (PFU) Overload: Plate transduction mixtures at high dilution to prevent confluent lysis from lytic phage, which would kill potential transductants.
Q4: Background growth or "breakthrough" colonies complicate all our low-frequency detection assays. How do we confirm true transfer events? A: Confirmation is critical. Implement a multi-layered verification protocol.
- Verification Protocol:
- PCR Confirmation: Design primers for the specific ARG and a backbone element (e.g., plasmid oriT, phage integrase, transposon) to confirm physical acquisition.
- Hybridization: Perform colony hybridization with a fluorescently labeled probe against the ARG.
- Genomic Evidence: For a subset of colonies, perform whole-genome sequencing or long-read PCR to show physical linkage of the ARG to a recipient genomic marker or plasmid backbone.
- Phenotypic Re-test: Streak purified colonies onto a gradient or multiple antibiotic plates to confirm the resistance phenotype is stable and matches the expected level.
Table 1: Comparison of Methodological Limits of Detection (LOD) for ARG Transfer Assays
| Transfer Mechanism | Conventional Plating LOD (Transfer Frequency) | Enhanced Method (e.g., FACS, Enrichment) | Improved LOD (Transfer Frequency) | Key Limiting Factor |
|---|---|---|---|---|
| Conjugation | ~10⁻⁷ - 10⁻⁸ | Fluorescence-Activated Cell Sorting (FACS) | ~10⁻⁹ - 10⁻¹⁰ | Recipient overgrowth, low mating efficiency |
| Transformation | ~10⁻⁹ - 10⁻¹⁰ | Carrier DNA + concentrated high-volume eDNA | ~10⁻¹¹ - 10⁻¹² | DNA degradation, low competence state |
| Transduction | ~10⁻⁸ - 10⁻⁹ | Magnetic bead panning + high MOI infection | ~10⁻¹⁰ - 10⁻¹¹ | Lysate toxicity, low transducing particle ratio |
Table 2: Essential Controls for Low-Frequency Transfer Experiments
| Control Type | Purpose | Expected Result for Valid Experiment |
|---|---|---|
| Donor + Selective Media | Checks for donor death on counter-selection | No growth |
| Recipient + Selective Media | Checks for pre-existing recipient resistance | No growth (or minimal background) |
| DNase-treated Transformation Mix | Distinguishes transformation from transduction | Reduced/no transformants vs. untreated |
| Free DNA + No Cells (Transformation) | Checks for sterile technique | No growth |
| Phage Lysate + No Cells (Transduction) | Checks for lysate sterility | No growth |
| Mating Mixture + Plasmidsafe DNase | Inhibits transformation during conjugation | No change in transconjugant count |
Experimental Protocols
Protocol 1: FACS-Enhanced Conjugation Assay for Sub-Detectable Transfer Objective: Detect conjugation events below 10⁻⁸ frequency.
- Strain Preparation: Grow donor (e.g., harboring GFP and a mobilizable plasmid with RFP and ARG) and recipient (with a chromosomal antibiotic resistance marker) to mid-exponential phase.
- Mating: Mix donor and recipient at a 1:1 ratio on a filter placed on non-selective agar. Incubate 2-18 hours.
- Cell Harvest: Resuspend cells from filter. Wash to separate loosely associated cells.
- FACS Enrichment: Use a flow cytometer to sort double-positive (GFP+/RFP+) cells, which are potential transconjugants, into recovery medium. Note: GFP signal may be weak if the chromosomal marker is not highly expressed.
- Recovery & Plating: Allow sorted cells to recover in rich medium for 4-6 hours. Plate on selective media that counters the donor and selects for both the recipient marker and the plasmid-borne ARG.
- Confirmation: Pick colonies for PCR and phenotypic re-testing as per FAQ Q4.
Protocol 2: Concentration-Enhanced Environmental DNA (eDNA) Transformation Objective: Detect ARG acquisition via natural transformation from complex environmental matrices.
- eDNA Extraction from Large Volume: Filter 10-100L of water sample through a 0.22µm membrane. Alternatively, process 10-100g of soil/sediment. Use a commercial kit designed for large-volume/high-inhibit samples.
- DNA Concentration: Perform ethanol precipitation in the presence of glycogen (20µg/mL) as carrier. Incubate at -80°C overnight, centrifuge at high speed (>12,000 x g) for 1 hour. Resuspend pellet in a minimal volume (e.g., 50µL) of TE buffer.
- Competence Induction: Grow the transformable recipient strain to early exponential phase. Add synthetic competence-stimulating peptide (CSP) at characterized inducing concentrations. Incubate 30-60 min.
- Transformation Assay: Mix 100µL of induced cells with 10-50µL of concentrated eDNA and 10µg of sheared salmon sperm carrier DNA. Incubate under transformation conditions.
- Selection & Confirmation: Plate on selective media. Include a DNase I-treated aliquot as a control. Confirm transformants via PCR for the ARG and a genomic marker.
Visualizations
Title: FACS-Enhanced Conjugation Detection Workflow
Title: Core Mechanisms of HGT: Conjugation, Transformation, Transduction
The Scientist's Toolkit: Research Reagent Solutions
| Item | Function in Low-Frequency Detection |
|---|---|
| Fluorescent Protein Markers (GFP, RFP) | Chromosomal integration allows visual tagging of donor and recipient strains for FACS enrichment and microscopy validation. |
| Membrane-Filter Units (0.22µm) | For filter mating assays in conjugation and concentrating microbial biomass from large liquid samples for eDNA extraction. |
| DNase I (RNase-free) | Critical control enzyme to degrade free DNA in transduction and conjugation assays, confirming mechanism. |
| Carrier DNA (e.g., Sheared Salmon Sperm DNA) | Protects low-concentration, ARG-bearing eDNA during transformation by saturating nucleases and non-specific binding sites. |
| Synthetic Competence-Stimulating Peptides (CSP) | Chemically defined peptides to induce the competent state in specific bacterial species, maximizing transformation efficiency. |
| Plasmidsafe ATP-Dependent DNase | Degrades linear chromosomal DNA but not circular plasmids. Used in conjugation assays to kill donor cells and reduce background. |
| Magnetic Beads with Streptavidin | Can be conjugated with biotinylated antibodies or host-specific ligands to pan and enrich phage particles capable of infecting a target host. |
| Gradient Antibiotic Strips/Microplates | Used to precisely determine the Minimum Inhibitory Concentration (MIC) of putative transconjugants, confirming phenotypic resistance. |
| Next-Generation Sequencing (NGS) Kits | For whole-genome sequencing of purified colonies to provide definitive genomic evidence of ARG acquisition and location. |
| Flow Cytometer with Cell Sorter (FACS) | Essential instrument for physically separating and enriching extremely rare potential transfer events based on fluorescent markers. |
FAQ: Core Concepts & Rationale
Q1: Why should my protocol for detecting plasmid transfer be optimized for rare events? A: Clinically relevant resistance often emerges from rare transfer events that seed reservoirs in recipient populations. These low-frequency events are missed by standard conjugation assays, leading to an underestimation of transfer potential and, ultimately, unforeseen treatment failures. Optimizing for rare events is critical for accurate risk assessment.
Q2: What is the primary source of false negatives in low-frequency ARG transfer experiments? A: The overwhelming background of donor and recipient cells that have not engaged in conjugation masks the rare transconjugants. Insufficient selectivity and/or sensitivity in the plating protocol is the most common failure point.
Q3: How does the choice of selective markers impact detection sensitivity? A: Markers must provide absolute, uncompromising selection. Weak antibiotics or markers with high spontaneous mutation rates in the recipient strain will create background noise that obscures genuine transconjugants. Dual, complementary selection is often required.
Troubleshooting Guide: Common Experimental Issues
Issue 1: Excessive background growth on transconjugant selection plates.
- Potential Cause 1: Inadequate concentration of antibiotics to fully suppress recipient growth.
- Solution: Perform a Kill Curve assay to determine the Minimum Inhibitory Concentration (MIC) for each antibiotic against the recipient strain. Use at least 2x MIC in your selection plates.
- Potential Cause 2: Cross-feeding or metabolite exchange between dense donor/recipient cells on the filter.
- Solution: After mating, vigorously resuspend the conjugation mix in a large volume (e.g., 10 mL) of saline or buffer and perform serial dilutions (10⁻¹ to 10⁻³) before plating. This physically separates cells and reduces cooperative survival.
- Potential Cause 3: Spontaneous mutation of the recipient to resistance.
- Solution: Include a "recipient + selection" control plate. The count of spontaneous mutants must be subtracted from your putative transconjugant count. If it is too high, use a different selective marker or recipient strain.
Issue 2: No transconjugants detected, even with positive controls.
- Potential Cause 1: The selective markers are also inhibiting the transconjugants.
- Solution: Verify that the donor plasmid expresses resistance genes that are functional in the recipient host's genetic background. Check for promoter compatibility.
- Potential Cause 2: The conjugation conditions are suboptimal (time, temperature, medium).
- Solution: Standardize and optimize the mating protocol. See the detailed "Rare Event Conjugation Assay" protocol below.
- Potential Cause 3: The conjugation event is extremely rare (<10⁻⁹ per donor).
- Solution: Increase the scale of the mating reaction and the volume plated. Use large (e.g., 90 mm) plates and plate up to 1 mL of concentrated cell suspension per plate.
Detailed Experimental Protocol: Rare Event Conjugation Assay
Objective: To quantify the transfer frequency of an ARG-harboring plasmid at frequencies as low as 10⁻¹⁰ per donor cell.
Materials & Reagents:
- Donor strain: Contains mobilizable or conjugative plasmid with selectable markers (e.g., Ampᴿ, Kanᴿ).
- Recipient strain: Chromosomally encoded resistance to a different antibiotic (e.g., Rifᴿ, Nalᴿ), and susceptible to the plasmid's markers.
- Appropriate liquid and solid growth media (e.g., LB).
- Sterile saline (0.85% NaCl).
- Antibiotic stocks.
- Nitrocellulose or mixed cellulose ester membrane filters (0.22µm pore size).
- Filter manifolds (vacuum) or sterile forceps.
Procedure:
- Cultivation: Grow donor and recipient cultures separately to mid-exponential phase (OD₆₀₀ ~0.5-0.6).
- Normalization: Wash cells twice in sterile saline by centrifugation (5,000 x g, 5 min) to remove residual antibiotics.
- Mating: Mix donor and recipient at a ratio of 1:10 (e.g., 0.1 mL donor + 1.0 mL recipient) in a final volume of 1-2 mL. Concentrate 1 mL of this mixture onto a sterile filter placed on a vacuum manifold.
- Incubation: Place the filter, cell-side-up, on a pre-warmed, non-selective agar plate. Incubate for a standardized mating period (e.g., 6-18 hours) at optimal temperature (usually 37°C).
- Harvesting: Place the filter in a tube with 5-10 mL of sterile saline. Vortex vigorously for 2-3 minutes to resuspend cells.
- Dilution & Plating: Perform serial 10-fold dilutions (10⁰ to 10⁻³) of the resuspension.
- Plate appropriate dilutions on donor control plates (selecting for donor marker only).
- Plate appropriate dilutions on recipient control plates (selecting for recipient marker only).
- Plate 100µL of the undiluted and 10⁻¹ diluted resuspension on transconjugant selection plates (containing both antibiotics to select for the recipient marker and the plasmid marker).
- Calculation: Incubate all plates for 24-48 hours. Count colonies.
- Transfer Frequency = (Number of transconjugants) / (Number of donor cells at end of mating).
- Correct for background: Subtract any colonies from the "recipient + dual antibiotics" control plate.
Workflow for Detecting Rare ARG Transfer Events
Diagram Title: Workflow for Rare Conjugation Event Assay
Quantitative Data Summary: Impact of Protocol Modifications on Detection Sensitivity
Table 1: Effect of Experimental Variables on Transconjugant Yield
| Variable Tested | Standard Protocol | Optimized Protocol | Observed Change in Detection Limit |
|---|---|---|---|
| Mating Time | 2 hours | 18 hours (overnight) | Increase of 100-1,000x |
| Post-Mating Processing | Direct plating of filter | Vigorous resuspension & dilution | Background reduced by >99% |
| Selection Rigor | 1x MIC of antibiotics | 2-4x MIC of antibiotics | False positives reduced by ~90% |
| Plating Volume | 100 µL of neat mix | 1 mL of 10x concentrated cells | Effective assay volume increased 100x |
The Scientist's Toolkit: Key Research Reagent Solutions
Table 2: Essential Materials for Low-Frequency ARG Transfer Research
| Item | Function / Rationale | Example/Note |
|---|---|---|
| Counterselective Antibiotics | To fully suppress growth of the recipient strain on transconjugant selection plates. | Rifampicin, Nalidixic Acid, Cycloserine. Must have low spontaneous mutation rate in recipient. |
| Membrane Filters (0.22µm) | To facilitate close cell-cell contact for conjugation in a solid support environment. | Nitrocellulose (for bacteria) or mixed cellulose ester. |
| Chromosomal Marker Recipient | Provides a stable, non-transferable selectable trait to differentiate from donors. | Strain with chromosomally-integrated resistance gene or auxotrophy. |
| Mobilizable/Conjugative Plasmid with Reporter | Plasmid carrying ARG of interest and a traceable marker (e.g., fluorescent, luminescent). | Enables both selection and alternative detection (e.g., FACS, microscopy). |
| Automated Colony Counter/Imager | For accurate and high-throughput enumeration of colonies, especially on crowded plates. | Critical for reproducibility when counting large plates. |
| Fluorescence-Activated Cell Sorter (FACS) | To physically sort and enrich for rare transconjugants prior to plating, breaking the detection limit. | Used with fluorescent protein reporters on the plasmid. |
Pathway of Rare Event Leading to Treatment Failure
Diagram Title: Path from Rare Transfer to Treatment Failure
Current Gaps in Standard Surveillance and the Need for Enhanced Sensitivity
Technical Support Center: Troubleshooting Low-Frequency ARG Transfer Detection
FAQs & Troubleshooting Guides
Q1: Our conjugation assay shows no transconjugants on selective plates. The donor and recipient controls grow as expected. What is the primary issue? A: This is a classic symptom of insufficient assay sensitivity for low-frequency transfer events (<10^-8). Standard conjugation protocols often use a limited selection volume (e.g., 100 µL of a 1 mL mating mix), meaning events rarer than 1 in 10^7 are missed. Solution: Implement a filter mating concentration method. Concentrate the entire mating mix (e.g., 10-50 mL) onto a single filter or use large-volume plating (up to 20 mL of concentrate per large plate). This can improve the limit of detection by 2-3 orders of magnitude.
Q2: Metagenomic sequencing of our experimental microbiome samples fails to detect known, plasmid-borne ARGs that our qPCR confirms are present. Why? A: Standard metagenomic sequencing (e.g., 20-30 million reads) has limited sensitivity for low-abundance genes. At 30 million reads, a gene must be present at ~0.001% relative abundance for reliable detection, missing rare transfer events. Solution: Utilize ARG-targeted enrichment sequencing (e.g., capture probes) or ultra-deep sequencing (200+ million reads). Quantitative data on sensitivity thresholds is below.
Table 1: Sensitivity Limits of Common Surveillance Methods
| Method | Typical Limit of Detection (LOD) | Effective Volume/Depth Analyzed | Key Gap for Low-Frequency ARG Transfer |
|---|---|---|---|
| Standard Conjugation Assay | ~1x10^-7 transconjugants per donor | 0.1-1 mL of mating mix | Bulk plating misses ultra-rare events. |
| Filter Mating (Concentrated) | ~1x10^-9 - 1x10^-10 | 10-50 mL concentrated | Vastly superior but labor-intensive. |
| Shotgun Metagenomics | ~0.001% relative abundance | 20-30 million reads | Misses genes on rare plasmids in complex communities. |
| Enrichment Sequencing | ~0.0001% relative abundance | 20M reads post-capture | Better but requires prior sequence knowledge. |
| qPCR/dPCR | 1-10 gene copies per reaction | Microliter-scale sample | Highly sensitive but requires specific primers; no discovery. |
Q3: We suspect plasmid transfer is occurring at low levels in a complex environment, but cannot isolate pure transconjugants for confirmation. How can we validate transfer? A: Use Fluorescence-Activated Cell Sorting (FACS) coupled with marker-specific labeling. Label the donor strain with a constitutively expressed fluorescent protein (e.g., GFP) and the recipient with a different one (e.g., mCherry). After mating, sort double-positive cells (putative transconjugants) directly onto selective plates or into lysis buffer for PCR. This physically enriches rare events before selection.
Q4: In our high-throughput screening, distinguishing true low-frequency transfer from cross-contamination or spontaneous mutation is challenging. A: Implement a triple-check diagnostic PCR on all putative transconjugant colonies. This protocol confirms the presence of: 1) The transferred ARG, 2) A plasmid-specific backbone gene (e.g., rep gene) not found in the donor chromosome, and 3) A recipient-specific genetic marker (e.g., a chromosomal gene). Only colonies positive for all three are valid transconjugants.
Experimental Protocol: Enhanced Sensitivity Filter Mating for Ultra-Rare Transfer Events
Objective: Detect conjugation events at frequencies as low as 10^-10. Materials:
- Donor and recipient cultures (late log phase).
- Appropriate liquid and solid media with selective antibiotics.
- Sterile 0.22µm cellulose nitrate membrane filters.
- Filtration manifolds.
- 50mL conical tubes.
Methodology:
- Mating: Mix donor and recipient cells at an optimized ratio (e.g., 1:10 donor:recipient) in a large volume of non-selective broth (e.g., 50 mL). Incubate with gentle shaking for the desired mating period (e.g., 18h).
- Concentration: Instead of plating aliquots, concentrate the entire 50 mL mating mix by centrifugation (e.g., 4000 x g, 15 min). Resuspend the cell pellet in 1-2 mL of fresh medium.
- Plating: Plate the entire concentrated suspension onto large, selective agar plates (e.g., 150mm x 15mm plates) that select for the recipient and the transferred plasmid-borne ARG. Use 0.5-1 mL of concentrate per plate, spread evenly.
- Enumeration: Incubate plates and count colonies. Calculate the transfer frequency as: (Number of transconjugants) / (Number of donor cells at the start of mating). The use of the entire volume lowers the detectable frequency limit dramatically.
The Scientist's Toolkit: Key Research Reagent Solutions
Table 2: Essential Materials for Optimized ARG Transfer Detection
| Item | Function & Rationale |
|---|---|
| Cellulose Nitrate Membrane Filters (0.22µm, 47mm) | For standard filter mating; provides close cell-cell contact for conjugation. |
| Fluorescent Protein Plasmids (e.g., pGFP, pmCherry) | For fluorescent tagging of donor/recipient strains, enabling tracking and FACS enrichment. |
| Mobilizable or Broad-Host-Range Reporter Plasmids | Model plasmids with tracable markers (e.g., lacZ, lux) to standardize and quantify transfer efficiency. |
| Droplet Digital PCR (ddPCR) Master Mix | For absolute, sensitive quantification of ARG copy numbers without standard curves, ideal for low-copy detection. |
| Metagenomic Enrichment Probes (e.g., Twist Biopharma Pan-ARG Panel) | To enrich sequencing libraries for ARG targets, increasing sensitivity >100x over shotgun sequencing. |
| Chromosomal Tagging Systems (e.g., Tn7 transposon) | For stable, single-copy insertion of selective/visual markers into recipient chromosomes. |
| Large (150mm) Square Bioassay Plates | Allow plating of up to 20mL of soft agar/cell mixture, increasing the sampled volume. |
Visualizations
Title: Gaps in Standard Surveillance and Sensitivity Solutions
Title: Sensitivity Comparison: Shotgun vs Enrichment Sequencing
Title: Enhanced Sensitivity Filter Mating Protocol
Cutting-Edge Techniques for Capturing Elusive ARG Transfer Events
Technical Support Center: Troubleshooting Low-Frequency ARG Detection
Frequently Asked Questions (FAQs)
Q1: In ddPCR for low-frequency ARG (e.g., blaCTX-M) detection, I get many failed or saturated partitions. How can I optimize droplet generation and thermal cycling? A1: Failed or saturated partitions indicate suboptimal reaction conditions.
- Cause 1: Input DNA concentration is too high. For low-frequency targets (<0.1%), keep total DNA between 1-10 ng/µL for the reaction mix.
- Solution: Dilute your environmental or metagenomic DNA sample and re-run.
- Cause 2: Improper droplet generator cartridge priming or clogging.
- Solution: Ensure the cartridge is at room temperature. Use fresh, filtered DG Cartridge Oil. Follow priming steps precisely; if clogging persists, replace the rubber gasket.
- Protocol: ddPCR Droplet Generation Optimization.
- Prepare 20 µL reaction mix: 10 µL ddPCR Supermix for Probes (no dUTP), 1 µL each of forward/reverse primer (18 µM), 0.5 µL probe (5 µM), 2-5 µL template DNA (adjusted to 5 ng/µL), nuclease-free water to volume.
- Load 20 µL sample and 70 µL Droplet Generation Oil into the DG8 cartridge.
- Generate droplets using the droplet generator.
- Transfer 40 µL of droplets to a 96-well PCR plate. Seal with a pierceable foil seal.
- Run PCR: 95°C for 10 min; 40 cycles of 94°C for 30 sec and 58°C for 60 sec (ramp rate 2°C/sec); 98°C for 10 min; 4°C hold.
Q2: My Nested PCR for rare vanA genes shows non-specific bands or primer-dimer artifacts after the second round. How do I increase specificity? A2: Nested PCR is prone to carryover contamination and mis-priming.
- Cause 1: Amplicon contamination from first-round products.
- Solution: Physically separate pre- and post-PCR areas. Use dedicated pipettes and aerosol-filter tips. Incorporate dUTP and UNG treatment in the first-round master mix to degrade carryover amplicons.
- Cause 2: Excessive primer concentration or low annealing temperature in the second round.
- Solution: Titrate nested (inner) primer concentration from 0.1-0.5 µM. Perform a gradient PCR to determine the optimal annealing temperature (usually 2-5°C higher than the first round's Tm).
- Protocol: dUTP/UNG Nested PCR for vanA Detection.
- First Round: 25 µL reaction: 1X PCR buffer, 200 µM dNTP mix (with dUTP replacing dTTP), 0.4 µM outer primers, 0.2 U/µL UNG, 1.25 U Hot Start DNA polymerase, 5 µL template DNA. Cycle: 37°C for 10 min (UNG); 95°C for 5 min; 25 cycles of 95°C/30s, 55°C/30s, 72°C/45s.
- Second Round: Use a 1:50 dilution of first-round product as template. Master mix as above but without dUTP/UNG. Use inner primers. Cycle: 95°C for 5 min; 35 cycles of 95°C/30s, 62°C/30s, 72°C/30s.
Q3: In digital hybridization assays (e.g., for mcr-1), I observe high background fluorescence, masking true positive signals. What steps reduce noise? A3: High background often stems from non-specific probe binding or inadequate washing.
- Cause 1: Insufficient blocking of the microarray or slide surface.
- Solution: Extend blocking time. Use a stringent blocking buffer (e.g., 5% BSA, 0.1% SDS in 5X SSC) for 45 minutes at 45°C.
- Cause 2: Wash stringency is too low.
- Solution: Increase temperature of post-hybridization washes to 50°C. Include a final low-salt wash (0.1X SSC, 0.1% SDS) for 5 minutes.
- Protocol: Low-Background Digital Hybridization Protocol.
- Hybridization: Apply labeled, fragmented DNA to array in hybridization buffer. Use a volume just sufficient to cover the surface (e.g., 100 µL under a lifter slip). Hybridize at 55°C for 16h in a humidified chamber.
- Washing: Perform sequential washes: i) 2X SSC, 0.1% SDS at 50°C for 5 min; ii) 1X SSC at 50°C for 5 min; iii) 0.1X SSC at 50°C for 5 min. Agitate gently.
- Scanning: Dry slides immediately with nitrogen gas and scan using appropriate laser settings, adjusting PMT gain to minimize background saturation.
Table 1: Comparison of High-Sensitivity Tools for Low-Frequency ARG Detection
| Parameter | ddPCR | Nested PCR | Digital Hybridization Assay |
|---|---|---|---|
| Theoretical Detection Limit | 0.001% (1 copy in 100,000) | 0.01% (with strict controls) | 0.01% (depends on probe design) |
| Absolute Quantification? | Yes, without standard curve | No (semi-quantitative) | Yes, based on spot intensity |
| Precision (CV for <0.1% target) | <10% | >25% | 15-20% |
| Multiplexing Capacity | Moderate (2-4 plex) | Low (typically 1-plex) | High (100s-1000s of targets) |
| Risk of Contamination | Low (closed-tube) | Very High (open-tube) | Moderate (post-PCR only) |
| Typical Time-to-Result | 4-6 hours | 6-8 hours | 24-48 hours (incl. labeling) |
| Optimal Input DNA | 1-100 ng | 10-100 ng | 50-500 ng |
| Key Advantage | Absolute quant, high precision | Extreme sensitivity, low cost | High-throughput, discovery |
Table 2: Troubleshooting Summary: Common Errors & Fixes
| Symptom | Likely Cause | Immediate Action | Preventive Measure |
|---|---|---|---|
| ddPCR: Low droplet count (<10,000) | Cartridge or tubing clog | Replace consumables, filter oil | Equilibrate all reagents to RT before use. |
| Nested PCR: No product in 2nd round | Over-dilution of 1st round product | Test a dilution series (1:10, 1:50, 1:100) | Optimize cycle number in 1st round (avoid plateau). |
| Digital Hybridization: Low Signal | Probe degradation or poor labeling | Check probe integrity (QC); re-label sample | Use fresh fluorescent dyes, protect from light. |
| All Methods: Inconsistent replicates | Inhibitors in sample (e.g., humic acid) | Dilute sample or use inhibitor cleanup kit | Include internal control (spike-in) in each reaction. |
Experimental Workflow Diagrams
Title: ddPCR Workflow for Absolute Quantification
Title: Nested PCR Spatial Containment Protocol
Title: Digital Hybridization Assay Signal Logic
The Scientist's Toolkit: Research Reagent Solutions
Table 3: Essential Materials for Optimizing Low-Frequency ARG Detection
| Item & Example Product | Function in Experiment | Critical Note for Low-Frequency Targets |
|---|---|---|
| ddPCR Supermix for Probes (no dUTP) (Bio-Rad) | Provides reagents for probe-based PCR in droplets. | Using "no dUTP" version prevents possible interference with some DNA polymerases, crucial for maximizing efficiency in rare target amplification. |
| DG Cartridge & Droplet Generation Oil (Bio-Rad) | Generates uniform water-in-oil emulsion partitions. | Cartridge lot consistency is key for reproducible partition volume (0.85 nL) required for accurate Poisson calculations. |
| UNG Enzyme & dUTP Mix (Thermo Fisher) | Prevents carryover contamination by degrading uracil-containing prior amplicons. | Essential for nested PCR workflows. Must be inactivated before second-round amplification (heat step at 95°C). |
| Hot-Start High-Fidelity DNA Polymerase (NEB Q5) | Reduces mis-priming and increases amplification accuracy. | Critical for minimizing errors in early cycles when amplifying ultra-rare targets from complex backgrounds. |
| Array-Based Hybridization Buffer (Agilent) | Promotes specific binding of labeled DNA to surface probes. | Must be optimized for salt and formamide concentration to balance signal strength and specificity for ARG variants. |
| Nuclease-Free Water (PCR Grade) | Solvent for all reaction mixes. | Trace nuclease contamination can degrade rare templates; use certified, aliquoted stocks. |
| Solid-Phase Reversible Immobilization (SPRI) Beads (Beckman Coulter) | Size-selects and purifies DNA post-amplification or for library prep. | Allows removal of primer-dimers after first-round PCR, improving specificity of second-round or hybridization input. |
Long-Read and Ultra-Deep Sequencing Strategies for Identifying Rare Recombinants
Technical Support Center: Troubleshooting & FAQs
Frequently Asked Questions
Q1: We are using PacBio HiFi reads for recombinant detection, but our consensus accuracy is lower than expected (
- Actionable Steps:
- Verify Coverage: Ensure you have ≥20x raw subread coverage per haplotype. For complex mixtures, aim for 50-100x.
- Assess Template Integrity: Run genomic DNA on a pulsed-field gel. SMRTbell library construction is sensitive to DNA shearing. Use high molecular weight (HMW) DNA extraction protocols.
- Check Sequencing Chemistry: Use the latest Sequel II/IIe binding kit 2.2 and sequencing kit 2.0. Older chemistries yield shorter reads and lower accuracy.
Q2: During Oxford Nanopore (ONT) ultra-deep sequencing for rare variant detection, we encounter high error rates that obscure true recombinants. How can we mitigate this? A2: ONT's higher raw error rate requires robust bioinformatic polishing and duplex sequencing.
- Actionable Steps:
- Implement Duplex Sequencing: Use kit SQK-DCS109 or similar. Duplex reads provide consensus accuracy >Q30, essential for rare variant calling.
- Optimal Basecalling: Use the super-accuracy (sup) model in Dorado v7+ with modified bases (5mC, 6mA) enabled if your DNA is methylated.
- Multi-Tool Polishing: Create a consensus pipeline:
Medaka→HyPo(using Illumina short reads as reference) →Racon.
Q3: Our Illumina ultra-deep sequencing (50,000x coverage) fails to distinguish true low-frequency ARG recombinants from PCR duplicates or artifacts. How do we resolve this? A3: This is a classic issue in ultra-deep sequencing for recombination. Deduplication and unique molecular identifiers (UMIs) are critical.
- Actionable Steps:
- Incorporate UMIs: Use a library prep kit with UMIs (e.g., Twist UMI Adapters). This tags each original molecule before amplification.
- Bioinformatic Deduplication: Use
fgbioorUMI-toolsfor consensus grouping based on UMI and mapping coordinates, not just sequence identity. - Validate with an Alternate Technology: Confirm putative recombinants (<0.1% frequency) with a targeted long-read assay (e.g., PacBio Amplicon Sequencing).
Q4: When assembling recombinant genomes from metagenomic long-read data, chimeric assemblies are common. How can we improve fidelity? A4: Chimeras arise from spurious alignments of repetitive elements (e.g., mobile genetic elements flanking ARGs).
- Actionable Steps:
- Use Hybrid Assembly: Combine long reads (ONT/PacBio) with high-accuracy short reads (Illumina) using
UnicyclerorSPAdesin hybrid mode. - Apply Assembly Correction: Polish the assembly with short reads using
NextPolishand then validate contigs against raw reads withminimap2andBandagefor visualization. - Check for Overlaps: Manually inspect assembly graph (
Bandage) for circularized contigs or repeat-resolved structures indicative of true plasmids.
- Use Hybrid Assembly: Combine long reads (ONT/PacBio) with high-accuracy short reads (Illumina) using
Troubleshooting Guides
Issue: No recombinants detected despite high coverage.
- Potential Cause 1: Bioinformatics pipeline is too stringent.
- Solution: Relax variant calling filters incrementally. For
LoFreq, try-–call-indelsand lower--min-alt-bqto 20. Re-evaluate with positive controls.
- Solution: Relax variant calling filters incrementally. For
- Potential Cause 2: Recombination event is in a region of low mappability.
- Solution: Generate an in silico mappability track (
GEMlibrary) and mask problematic regions. Consider targeted enrichment (Capture-Seq) for these areas.
- Solution: Generate an in silico mappability track (
Issue: High background noise (false positive recombinants) in ultra-deep Illumina data.
- Potential Cause 1: Oxidative DNA damage during shearing (common in FFPE or old samples).
- Solution: Treat samples with
NEBNext FFPE DNA Repair MixorPreCR Repair Mixbefore library prep.
- Solution: Treat samples with
- Potential Cause 2: Polymerase errors during early PCR cycles are amplified.
- Solution: Use a high-fidelity polymerase (Q5, Phusion) with minimal PCR cycles. Employ UMI-based error correction as described in FAQ Q3.
Issue: Long-read sequencing coverage is highly uneven, missing key regions.
- Potential Cause: Sequence-specific bias or GC-rich regions causing polymerase stalling.
- Solution: For ONT, use a different library prep kit (e.g., Rapid Sequencing vs. Ligation). For PacBio, increase polymerase binding time. Spike-in a control DNA with known GC extremes to monitor bias.
Data Presentation
Table 1: Comparison of Sequencing Platforms for Rare Recombinant Detection
| Platform (Typical Use) | Raw Read Accuracy | Optimal Read Length | Recommended Depth for <0.1% variant | Key Strength for Recombinants | Primary Artifact Concern |
|---|---|---|---|---|---|
| Illumina (Ultra-Deep) | >Q30 (99.9%) | 2x150 bp | 50,000 - 100,000x | Unmatched quantitative accuracy for frequency | PCR duplicates, base substitution errors |
| PacBio (HiFi Mode) | >Q30 (99.9%) | 10-25 kb | 50-100x (per haplotype) | Phasing over long distances, structural variant detection | Coverage drop in high-GC regions |
| ONT (Duplex) | >Q30 (99.9%) | 10-100+ kb | 100-200x (per haplotype) | Real-time, longest reads, direct methylation detection | Throughput variability, sample prep complexity |
Table 2: Bioinformatic Tools for Recombinant Detection Workflows
| Tool | Primary Function | Recommended Use Case | Key Parameter for Rare Variants |
|---|---|---|---|
| LoFreq | Variant calling from deep short-read data | Illumina ultra-deep sequencing | --min-alt-bq (20-25), --min-mq (30) |
| Clair3 | Variant calling from long-read data | PacBio HiFi / ONT Duplex reads | --model_path (use platform-specific model) |
| Flye | Long-read de novo assembly | Metagenomic plasmid assembly | --meta (for complex samples), --plasmids |
| CIRCOS | Visualization of recombination breakpoints | Final validation and figure generation | -conf (customize ideogram/links) |
Experimental Protocols
Protocol 1: UMI-Based Ultra-Deep Illumina Sequencing for Recombinant Quantification
- Objective: Accurately quantify ARG recombinants at frequencies as low as 0.01%.
- Materials: HMW genomic DNA, Twist UMI Adapter Kit, Q5 High-Fidelity Master Mix, AMPure XP beads.
- Steps:
- Fragmentation: Shear 100 ng DNA to 350 bp (Covaris).
- End-Repair & A-Tailing: Perform using NEBNext Ultra II modules.
- UMI Adapter Ligation: Ligate Twist UMI adapters. Clean up with 0.8x AMPure beads.
- PCR Amplification: Amplify with 8 cycles of PCR. Clean up with 1x AMPure beads.
- Sequencing: Pool and sequence on Illumina NovaSeq, 2x150 bp, targeting 50,000x average coverage.
- Analysis: Process with
fgbio:ExtractUmisFromBam→GroupReadsByUmi→CallMolecularConsensusReads→ align and call variants withLoFreq.
Protocol 2: Targeted Long-Read Sequencing of Recombinant Loci
- Objective: Resolve the full-length structure of suspected recombinant ARG cassettes.
- Materials: Specific primers flanking recombination hotspot, PacBio SMRTbell Prep Kit 3.0, BluePippin (15 kb cutoff).
- Steps:
- Amplification: Generate ~10 kb amplicon using PrimeSTAR GXL polymerase (30 cycles).
- Size Selection: Run on BluePippin to remove non-specific products.
- SMRTbell Library Prep: Construct library per kit protocol. Use a 1:10 polymerase:template binding ratio.
- Sequencing: Load on Sequel IIe with 30-hour movie time.
- Analysis: Generate HiFi consensus reads with
ccs. Map to reference withpbmm2. Call structural variants withpbsv. Visualize withIGV.
Diagrams
Title: Hybrid Sequencing Workflow for Rare Recombinant Identification
Title: Dual-Path Bioinformatics Analysis Logic
The Scientist's Toolkit: Research Reagent Solutions
Table 3: Essential Reagents and Kits for Recombinant Capture Sequencing
| Item | Function & Role in Experiment | Example Product |
|---|---|---|
| High Molecular Weight (HMW) DNA Preservation Buffer | Preserves long DNA fragments crucial for long-read sequencing of intact recombinant structures. | Circulomics HMW DNA Storage Buffer |
| Methylation-Free Enzyme Mixes | Critical for preparing DNA from bacteria where restriction-modification systems can cleave unmethylated foreign DNA, preserving recombinant plasmids. | NEBNext Microbiome DNA Enrichment Kit |
| CRISPR-based Enrichment System | Targets and enriches specific ARG-carrying vectors from complex samples prior to sequencing, increasing sensitivity. | Arbor Biosciences myBaits Hybridization Capture |
| Duplex Sequencing Adapter Kit | Enables generation of ultra-accurate consensus reads from Oxford Nanopore data, reducing false positives. | Oxford Nanopore SQK-DCS109 |
| Unique Molecular Identifier (UMI) Adapters | Tags each original DNA molecule pre-amplification, allowing bioinformatic removal of PCR duplicates and errors in ultra-deep sequencing. | Twist UMI Adapters |
| Long-Range Polymerase for Amplicon Sequencing | Amplifies long, recombination-prone genomic regions (>10 kb) for targeted long-read sequencing. | PrimeSTAR GXL DNA Polymerase |
| Magnetic Beads for Size Selection | Precisely selects desired fragment sizes, removing short fragments that hinder long-read assembly. | Sage Science BluePippin (15-20 kb cutoff) |
Troubleshooting Guide & FAQs
Fluctuation Assay
Q1: Why are my fluctuation assay results showing high variance between replicates when detecting low-frequency ARG transfer events? A: High variance often stems from inconsistent initial cell density or insufficient mixing of the selective agent. Ensure the pre-culture is in mid-exponential phase and dilute to a precise, low density (e.g., 100-1000 cells/mL) before distributing into multi-well plates. Vortex the antibiotic stock thoroughly before adding it to the media at a concentration that is 2x the MIC of the recipient strain. Inadequate mixing can create "hot spots" of selection, skewing mutant counts.
Q2: How do I determine the optimal number of replicates and cell population size per replicate for my ARG transfer assay? A: This depends on the expected transfer frequency. For very low frequencies (<10^-8), use a larger population per culture. The following table, based on Poisson distribution principles, provides guidance:
| Expected Transfer Frequency | Recommended Cells per Replicate | Minimum Number of Replicates | Purpose |
|---|---|---|---|
| 10^-6 to 10^-7 | 10^7 | 12-24 | Routine screening |
| 10^-8 to 10^-9 | 10^8 | 24-48 | Detecting rare events |
| <10^-9 | 10^9 | 48+ | Ultra-sensitive detection |
Continuous Evolution Systems (e.g., ALE, Chemostats, TRACE)
Q3: My continuous evolution chemostat is becoming contaminated with phage or fungal spores. How can I prevent this? A: Implement a multi-barrier sterile approach. Use 0.22 µm venting filters on all inlet and outlet lines. Regularly replace tubing upstream of the culture vessel. Consider incorporating inline UV sterilizers for media inflow. For fungal spores, adding Amphotericin B at 0.25 µg/mL to the media reservoir can be effective, but first confirm it does not interfere with your ARG selection pressure.
Q4: The selection pressure in my multiplex automated genome evolution (MAGE) cycle seems to be decreasing over time. What could cause this? A: This is often due to antibiotic degradation or evolved resistance that alters the effective selection. Monitor antibiotic concentration in the media reservoir via HPLC or bioassay daily. Ensure the selection marker is tightly linked to the evolving ARG of interest to prevent "cheater" genotypes from taking over. Implement a dual selection system or periodic bottlenecking to maintain linkage.
Q5: In a TRACE system, I am not observing the expected enrichment of conjugative plasmids carrying the target ARG. What should I check? A: First, verify the functionality of the inducible promoter driving the essential gene on the plasmid. Perform a plating assay with and without the inducer. Second, ensure the recipient strain lacks the essential gene on its chromosome. Third, check for satellite colony formation around primary colonies on your selection plates, which may indicate cross-feeding. Re-design the essential gene to be involved in a metabolic pathway not easily supplemented by neighboring cells.
Experimental Protocols
Protocol 1: Modified Luria-Delbrück Fluctuation Assay for ARG Transfer
- Prepare Cultures: Grow donor (carrying ARG) and recipient strains separately to mid-log phase (OD600 ~0.5) in non-selective broth.
- Mating: Mix donor and recipient at a 1:10 ratio (e.g., 0.1 mL donor + 0.9 mL recipient). Pellet cells (5000 x g, 2 min) and resuspend in 50 µL of broth to promote cell-cell contact. Spot onto a non-selective agar plate and incubate for conjugation (e.g., 2 hours at 37°C).
- Resuspend & Dilute: Harvest the mating mix into 1 mL of broth. Perform a serial dilution to estimate total viable cells on non-selective agar.
- Distribution: Dilute the mating mix to a final density of approximately 1000 total cells/mL. Distribute 100 µL aliquots into each well of 10-20 x 96-well plates (yielding ~100 cells/well). Fill all wells with 100 µL of fresh, non-selective broth.
- Outgrowth: Incubate plates statically for 24-48 hours to allow growth and potential ARG transfer.
- Selection: Using a multichannel pipette, spot 5 µL from each well onto agar plates containing a selective antibiotic (for the ARG) and a counterselective agent (to inhibit the donor strain).
- Analysis: Count wells that show transconjugant growth. Calculate the transfer rate using the Ma-Sandri-Sarkar maximum likelihood estimator (see table below).
Protocol 2: Establishing a Chemostat for Continuous Evolution of ARG-Harboring Plasmids
- Apparatus Setup: Assemble a glass or single-use bioreactor with a working volume of 100-500 mL. Connect to a media reservoir and a waste flask via peristaltic pumps. Calibrate pumps to achieve the desired dilution rate (D). Typical D for bacteria is 0.1-0.5 per hour.
- Inoculation: Grow the bacterial strain carrying the ARG plasmid to mid-log phase. Inoculate the chemostat vessel to an initial OD600 of ~0.05.
- Initiation: Start the medium feed and waste removal pumps simultaneously once the culture reaches late exponential phase (OD600 ~0.8). This is time = 0.
- Selection & Monitoring: Maintain a sub-inhibitory concentration of antibiotic in the inflowing medium to select for plasmid retention. Monitor OD600, pH, and plasmid stability (by plating on selective vs. non-selective media) daily.
- Sampling: Regularly sample the effluent for genomic analysis (e.g., sequencing to identify evolved mutations) and to measure plasmid transfer frequency to fresh recipient cells in mating assays.
Table 1: Comparison of Evolution Method Characteristics
| Method | Typical Time Scale | Throughput | Control Over Selection Pressure | Best for Detecting Frequencies Below |
|---|---|---|---|---|
| Fluctuation Assay | Days | Medium (10^2-10^3 cultures) | Static, fixed | 10^-9 |
| Serial Passaging | Weeks | Low | Stepwise, can vary | 10^-7 |
| Chemostat (Continuous Culture) | Weeks to Months | Low | Constant, tunable | 10^-12 (over time) |
| TRACE/OrthoRep | Weeks | Medium | Dynamic, real-time tunable | 10^-10 |
Table 2: Common Reagents for ARG Transfer & Evolution Studies
| Reagent / Solution | Function in Experiment | Key Consideration |
|---|---|---|
| Sodium Azide (0.1%) | Counterselective agent to inhibit donor E. coli growth in conjugation assays. | Handle with extreme toxicity caution. Effectiveness is strain-specific. |
| DNase I (10 µg/mL) | Added to mating mixes to prevent natural transformation of free DNA, ensuring detected ARGs are from conjugation. | Prepare fresh and verify activity. |
| Cycloserine or Streptomycin | Used in counterselection for recipient strains with specific auxotrophies or resistance markers. | Concentration must be meticulously titrated on control plates. |
| Anhydrous Tetracycline | A more stable, light-insensitive alternative for inducing Tet-on/off systems in continuous evolution setups. | Dissolve in DMSO; store at -20°C in the dark. |
| Phosphate Buffered Saline (PBS) for Mating | Provides optimal ionic strength for pilus formation and conjugation in many bacterial species. | Use at pH 7.2-7.4 for best results. |
Diagrams
Title: Fluctuation Assay Workflow for ARG Transfer
Title: Chemostat System for Continuous Evolution of ARGs
Fluorescent Reporter Systems and Single-Cell Sorting for Isolation and Tracking
Technical Support Center: Troubleshooting & FAQs
- Q1: My fluorescent reporter shows weak or no signal, despite confirmed plasmid transformation. What could be wrong?
- A: This is a common issue. Follow this diagnostic table:
| Possible Cause | Diagnostic Experiment | Solution |
|---|---|---|
| Weak Promoter Activity | Measure fluorescence of a positive control (e.g., constitutive promoter) in your strain. | Use a stronger, induction-specific promoter (e.g., PBAD, PTet). For ARG transfer, ensure promoter is active in recipient cells post-conjugation. |
| Protein Maturation Time | Perform a time-course measurement post-induction (e.g., 0, 30, 60, 120 min). | Allow sufficient time (1-2 hours) for fluorophore (especially RFP derivatives) to mature before sorting/imaging. |
| Incorrect Spectral Configuration | Image known positive control with your filter sets. | Verify excitation/emission filters/lasers match your fluorophore (e.g., GFP: Ex/Em ~488/510 nm; mCherry: ~587/610 nm). |
| Antibiotic Loss / Plasmid Instability | Plate cells on selective and non-selective media, then check fluorescence. | Maintain appropriate selection pressure. For tracking ARG loss, this may be intentional; use a stable chromosomal integration. |
- Q2: I am not recovering viable colonies after FACS-based single-cell sorting for low-frequency ARG transfer events.
- A: Cell viability post-sort is critical. Key parameters are below:
| Parameter | Typical Optimal Setting | Rationale |
|---|---|---|
| Sheath Pressure | Use the lowest possible (e.g., 20-25 psi for many instruments). | High pressure causes shear stress, reducing viability. |
| Nozzle Size | 100 µm or larger. | Larger diameter reduces shear stress. |
| Collection Medium | Rich medium (e.g., LB+20% glycerol) in a sterile, deep-well plate. | Provides immediate nutrients and cryoprotection. |
| Sorting Speed | < 5,000 events/sec for purity mode. | Lower speed improves recovery. Be patient for rare events. |
| Post-Sort Handling | Immediate incubation at optimal growth temperature. | Avoid leaving sorted cells on ice or at room temperature for extended periods. |
Experimental Protocol: Enrichment and Tracking of Low-Frequency Plasmid Transfer Events via Dual-Reporter FACS
1. Objective: To isolate and track recipient bacterial cells that have acquired an antibiotic resistance gene (ARG) via conjugation, using a dual-fluorescent reporter system.
2. Materials:
- Donor Strain: Contains conjugative plasmid with ARG and a constitutively expressed red fluorescent protein (RFP) (e.g., mCherry).
- Recipient Strain: Chromosomally encodes a constitutively expressed green fluorescent protein (GFP). Contains a selective marker different from the ARG.
- Induction System: The ARG on the conjugative plasmid is placed downstream of a promoter inducible in the recipient (e.g., a recipient-specific sigma factor promoter).
- Media: Appropriate liquid and solid media with selective antibiotics.
3. Procedure: 1. Conjugation: Mix donor and recipient strains at a defined ratio (e.g., 1:10) on a filter membrane placed on non-selective agar. Incubate for the desired conjugation period (e.g., 6-18 hours). 2. Cell Resuspension: Resuspend cells from the filter into fresh medium. Perform serial dilutions. 3. Antibiotic Selection: Apply selection for the recipient marker and the transferred ARG. Incubate to allow outgrowth of transconjugants and reporter expression/maturation. 4. FACS Gating & Sorting: * Gate on live, single cells based on forward/side scatter. * Gate on GFP+ cells (all recipients). * Within the GFP+ population, gate and sort the RFP+ population. These are transconjugants that received the plasmid. * For ultra-low frequency events, you may sort the entire RFP+ population into a single tube for enrichment. 5. Tracking & Analysis: Plate sorted cells on selective agar to obtain colonies. Track ARG stability by streaking colonies onto media with/without ARG selection and monitoring RFP fluorescence loss over generations.
Visualizations
The Scientist's Toolkit: Key Research Reagent Solutions
| Item | Function in Experiment | Example/Note |
|---|---|---|
| Fluorescent Protein Plasmids | Genetic tagging of donor/recipient and reporting ARG presence. | pGEN-mCherry (Donor), pUA66-GFP (Recipient Chromosome). Use fast-maturing variants (e.g., sfGFP, mCherry2). |
| Inducible Promoter Systems | Controls ARG expression specifically in the recipient post-transfer, linking signal to functional gene. | PBAD (arabinose-induced), PTet (aTc-induced). Ensures signal only in true transconjugants. |
| FACS Sheath Fluid | Sterile, particle-free fluid for hydrodynamic focusing of cells in the sorter. | Must be sterile and compatible with your bacterial strain (e.g., 1X PBS, 0.22 µm filtered). |
| High-Efficiency Electrocompetent Cells | For constructing reporter strains via chromosomal integration or plasmid transformation. | Essential for creating stable, labeled donor and recipient strains. |
| Selective Antibiotics | Maintains plasmid presence and selects for transconjugants. | Use at empirically determined minimum inhibitory concentration (MIC) to avoid fitness costs. |
| Cell Recovery Media | Supports viability of delicate, sorted single cells. | SOC or LB + 20% glycerol, pre-warmed. Use in sterile, validated collection tubes/plates. |
Integrating Metagenomic and Culturomic Approaches for Complex Communities
Troubleshooting Guides & FAQs
FAQ 1: Why is my metagenomic assembly failing to recover low-abundance ARGs, and how can I improve detection?
- Answer: This is often due to low sequencing depth or high host DNA contamination. To optimize for low-frequency ARG transfer detection:
- Increase Sequencing Depth: Aim for >20 Gb per complex sample to ensure sufficient coverage of rare community members.
- Apply Host DNA Depletion: Use commercial kits (e.g., NEBNext Microbiome DNA Enrichment Kit) to remove host/contaminant DNA prior to extraction.
- Employ Targeted Enrichment: Use probe-based hybridization capture (e.g., SureSelect) with panels designed for known ARG mobile genetic elements prior to sequencing.
- Optimize Assembly Parameters: Use a multi-assembler and reconciliation strategy (e.g., metaSPAdes + MEGAHIT, followed by DTA). See Table 1 for benchmark data.
FAQ 2: How do I handle overgrowth of fast-growing bacteria in my culturomics that obscures rare taxa carrying ARGs?
- Answer: Overgrowth is a common challenge in culturomics for low-frequency events. Mitigation strategies include:
- High-Throughput Dilution-to-Extinction: Dilute samples to 1-10 cells per well in 96- or 384-well plates. This physically separates species.
- Use of Growth-Inhibiting Substances: Add mild inhibitors (e.g., 0.05% bile salts, specific antibiotics at sub-inhibitory concentrations) to suppress dominant flora.
- Automated Colony Picking: Use a robotic picker (e.g, PIXL) to isolate colonies rapidly before overgrowth occurs.
- Supplement Media with Signaling Molecules: Add autoinducers (e.g., N-acyl homoserine lactones at 10-100 nM) to stimulate growth of quorum-sensing dependent, potentially slow-growing bacteria.
FAQ 3: My integrated analysis shows discordance between metagenomic and culturomic ARG profiles. What are the primary sources of this bias?
- Answer: Discordance is expected and informative. Key sources are summarized in Table 2.
- Actionable Steps: To reconcile data:
- Cross-Validate with qPCR: Use targeted qPCR for high-priority ARGs on both culture extracts and original sample DNA.
- Apply Immunomagnetic Separation: For a target host (e.g., E. coli), use antibody-coated beads to isolate cells from the original sample, then culture or perform direct lysis and PCR.
- Perform Genome-Resolved Metagenomics: Use binning tools (e.g., MaxBin2, MetaBAT2) on deep sequencing data to associate ARGs with putative host genomes, then compare to cultured isolate genomes.
FAQ 4: What is the most effective protocol to directly link a cultured isolate with an ARG transfer event observed in metagenomic data?
- Answer: Follow this detailed Conjugation Experiment Protocol to validate in situ transfer potential:
- Isolate Donor and Recipient: From your culture collection, select the ARG-positive isolate (donor) and a phylogenetically close, antibiotic-sensitive isolate (recipient). Mark the recipient with a neutral resistance marker (e.g., rifampicin resistance) via spontaneous mutation.
- Filter Mating: Grow donor and recipient to late exponential phase (OD600 ~0.8). Mix at a 1:1 ratio, concentrate, and spot onto a sterile 0.22µm filter placed on non-selective agar. Incubate 6-24h.
- Selection and Confirmation: Resuspend cells, plate on double-selective media (antibiotic for the ARG + antibiotic for the recipient marker). Incubate. Count transconjugant colonies.
- Calculate Transfer Frequency: (Number of transconjugant CFU) / (Number of recipient CFU). See Table 3 for expected ranges.
- Genomic Validation: Perform whole-genome sequencing on transconjugants to confirm ARG location (plasmid, chromosome) and absence of donor co-transferred DNA.
Data Tables
Table 1: Benchmarking of Metagenomic Assemblers for Low-Abundance ARG Recovery
| Assembler | Avg. Contig N50 (bp) | % of Known ARGs Recovered (High-Freq) | % of Known ARGs Recovered (Low-Freq <0.1%) | Computational Demand |
|---|---|---|---|---|
| metaSPAdes | 12,450 | 98% | 45% | High |
| MEGAHIT | 8,920 | 95% | 38% | Medium |
| IDBA-UD | 10,550 | 92% | 41% | Medium |
| Hybrid (metaSPAdes+MEGAHIT) | 15,780 | 99% | 67% | Very High |
Table 2: Sources of Bias in Metagenomic vs. Culturomic Approaches
| Approach | Bias For | Bias Against | Impact on Low-Freq ARG Detection |
|---|---|---|---|
| Metagenomics | Unculturable taxa, Free DNA, Dominant community members | Genes in low-abundance cells (<0.01% rel. abundance), High-GC content genomes | May miss ARGs in rare but transfer-active hosts. |
| Culturomics | Fast-growing, generalist aerobic bacteria, Spore-formers | Anaerobes, Slow-growing, Fastidious organisms, Obligate symbionts | May miss ARG hosts with strict growth requirements. |
Table 3: Expected ARG Transfer Frequencies in Validation Experiments
| Conjugation Matriz | Typical Transfer Frequency Range | Notes for Low-Frequency Detection |
|---|---|---|
| High-Efficiency Plasmid (e.g., RP4) | 10^-2 to 10^-1 per recipient | Use as a positive control. |
| Broad-Host-Range Plasmid (e.g., IncQ) | 10^-4 to 10^-3 per recipient | Common target for environmental ARG spread. |
| Chromosomal Element (ICE) | 10^-5 to 10^-6 per recipient | Requires deep sequencing or enriched mating for detection. |
| In situ (filter in sample matrix) | 10^-7 to 10^-10 per recipient | Requires high recipient counts (10^8-10^9) and selective enrichment for detection. |
Experimental Protocols
Protocol: High-Throughput Culturomics with Dilution-to-Extinction for Rare Taxa Objective: To isolate low-abundance bacteria from complex communities (e.g., gut, soil) for downstream ARG transfer analysis. Materials: Anaerobic chamber, 384-well plates, Non-selective rich media (e.g., Gifu Anaerobic Medium), Sterile PBS, Multichannel pipette. Procedure:
- Homogenize 1g of sample in 10ml pre-reduced PBS under anaerobic conditions.
- Perform serial 10-fold dilutions of the homogenate in PBS up to 10^-8.
- Using a multichannel pipette, dispense 50µl of each dilution (from 10^-4 to 10^-8) into 4 columns (16 wells) per dilution on a 384-well plate filled with 150µl of media per well. This yields 80 wells per dilution.
- Seal plates with breathable film and incubate at 37°C for 4-6 weeks. Monitor weekly for turbidity.
- At first sign of turbidity, subculture from the well onto solid media to check purity. The highest dilution positive wells (e.g., 10^-8) are most likely to contain slow-growing, rare taxa.
- Identify isolates via MALDI-TOF or 16S rRNA sequencing. Screen for ARGs via PCR or whole-genome sequencing.
Protocol: Probe Hybridization Capture for Enriching Low-Abundance ARG Sequences Objective: To enrich sequencing libraries for ARG and mobile genetic element (MGE) targets prior to metagenomic sequencing. Materials: Sheared metagenomic DNA (200-300bp), SureSelectXT HS2 Target Enrichment Kit, Custom biotinylated RNA bait library (e.g., covering CARD, INTEGRALL, and plasmid replicon databases), Magnetic streptavidin beads, Thermocycler. Procedure:
- Prepare sequencing library from metagenomic DNA according to standard Illumina protocols with dual-indexed adapters.
- Hybridize the library with the custom bait library at 65°C for 24 hours as per the SureSelect protocol.
- Bind bait-library hybrids to streptavidin beads, wash stringently to remove non-specific binding.
- Elute and amplify the captured library with indexing PCR (12 cycles).
- Clean up the library, QC via Bioanalyzer, and sequence. Expect a 100-1000x enrichment of on-target regions, allowing detection of sequences at <0.01% abundance in the original sample.
Visualizations
Title: Integrated Metagenomic & Culturomic Workflow for ARG Detection
Title: ARG Transfer Pathways and Detection Nodes
The Scientist's Toolkit: Research Reagent Solutions
| Item | Function in Low-Freq ARG Research |
|---|---|
| NEBNext Microbiome DNA Enrichment Kit | Depletes methylated host (e.g., human) DNA, increasing microbial sequence depth for rare taxa. |
| SureSelectXT Custom RNA Bait Library | Biotinylated RNA baits for hybrid-capture enrichment of specific ARG/MGE targets from metagenomic libraries. |
| Gifu Anaerobic Medium (GAM) Broth | Rich, non-selective medium for culturing a wide variety of fastidious and anaerobic bacteria in dilution-to-extinction. |
| CelluSelect Transconjugant Selection Plates | Pre-poured agar plates containing specific antibiotic combinations for direct selection of transconjugants after mating experiments. |
| Mycoplasma Experience PCR Detection Kit | Critical for confirming culture purity, as mycoplasma contamination can distort ARG PCR and transfer assay results. |
| Mobilizable Plasmid Positive Control (e.g., RP4) | Essential control plasmid with known high transfer frequency to validate conjugation assay conditions. |
| DNeasy PowerSoil Pro Kit | Standardized, high-yield DNA extraction kit for diverse complex samples, ensuring reproducibility in metagenomic studies. |
| FastDNA SPIN Kit for Feces | Optimized for tough-to-lyse Gram-positive bacteria, improving genomic representation in stool metagenomes. |
Overcoming Sensitivity Limits: A Troubleshooting Guide for Reliable Detection
Technical Support Center: Troubleshooting & FAQs
FAQ 1: Why is my qPCR assay for low-frequency ARG (antibiotic resistance gene) detection showing inconsistent Ct values or amplification failure after biomass concentration?
Answer: Inconsistent results often stem from co-concentration of PCR inhibitors (e.g., humic acids, polysaccharides, salts) during the biomass pelleting or filtration step. These inhibitors are prevalent in environmental or gut microbiome samples used in ARG transfer studies.
Troubleshooting Steps:
- Assess Inhibition: Perform a 1:5 and 1:10 dilution of your template DNA. A significant decrease in Ct (>2 cycles) with dilution indicates presence of inhibitors.
- Optimize Concentration Method: For filtration, switch to low-protein-binding membranes (e.g., polyethersulfone). For centrifugation, carefully optimize speed and time to pellet bacterial cells without compacting inhibitor complexes.
- Incorporate a Purification Wash: Add a wash step with a mild buffer (e.g., 10 mM Tris-EDTA, pH 8.0) after concentrating biomass but before DNA extraction.
Supporting Data: Recovery and Inhibition Post-Concentration
| Concentration Method | Target Biomass (Bacterial Cells) | Avg. Inhibitor Co-Concentration (Humic Acids, µg/µL in lysate) | Recommended Post-Concentration Step |
|---|---|---|---|
| Centrifugation (10k x g, 10 min) | 80-90% | 1.5 - 2.5 | TE Buffer Wash & Resuspension |
| Filtration (0.22 µm PES membrane) | 85-95% | 0.8 - 1.8 | Membrane Transfer to Wash Buffer |
| Microfluidic Capture (Chip-based) | 60-75% | 0.2 - 0.5 | On-chip Lysis Buffer Flush |
- Detailed Protocol: Optimized Biomass Concentration with Inhibitor Mitigation
- Materials: Sample, sterile TE buffer (10 mM Tris-HCl, 1 mM EDTA, pH 8.0), low-binding microcentrifuge tubes, 0.22 µm PES syringe filter (if filtering).
- Procedure:
- Concentration: Pass sample through a 0.22 µm PES filter using a syringe. Do not let the filter dry completely.
- Wash: Immediately pipette 1 mL of sterile, room-temperature TE buffer onto the filter. Apply gentle pressure to pass the wash through. Discard flow-through.
- Elution: Carefully cut the membrane with a sterile scalpel and transfer it to a bead-beating tube for immediate DNA extraction. Alternatively, for centrifugation pellets, resuspend the pellet in 1 mL TE buffer, re-pellet (8k x g, 5 min), and discard supernatant before proceeding to lysis.
FAQ 2: What is the most effective method to remove persistent inhibitors from complex samples (e.g., soil, sludge) for sensitive ARG qPCR without significant DNA loss?
Answer: For the most challenging samples, a combination of physical separation and chemical adsorption is required. Gel filtration chromatography (size exclusion) or dedicated inhibitor removal resin kits are highly effective.
Troubleshooting Steps:
- Evaluate Loss vs. Purity: Quantify DNA pre- and post-purification using fluorometry (Qubit). Compare qPCR Ct values for a conserved housekeeping gene (e.g., 16S rRNA gene) to calculate recovery efficiency.
- Optimize Resin Binding: When using inhibitor removal kits, ensure the sample-to-resin ratio and binding buffer pH are optimized for your sample matrix (see kit manual for adjustments).
- Validate with Spike-In Control: Use a synthetic, non-native DNA sequence spiked into the sample post-extraction to distinguish between inhibition and DNA degradation/loss.
Supporting Data: Comparison of Post-Extraction Inhibitor Removal Methods
| Purification Method | DNA Recovery Efficiency (%) | Humic Acid Removal Efficiency (%) | Suitability for Low-Biomass ARG Detection |
|---|---|---|---|
| Silica Column (Standard) | 70-80 | 60-75 | Moderate (Risk of inhibitor carryover) |
| Inhibitor Removal Resin (e.g., PCT) | 65-75 | 90-98 | High |
| Gel Filtration (Sephadex G-200) | 50-65 | 95-99 | Moderate (Lower recovery can impact sensitivity) |
| Ethanol Precipitation with Wash | 60-70 | 70-85 | Low-Moderate (Variable results) |
- Detailed Protocol: Post-Extraction Cleanup Using Inhibitor Removal Resin
- Materials: Crude DNA extract, commercial inhibitor removal resin slurry, binding buffer (often provided), collection tubes.
- Procedure:
- Condition: Vortex resin slurry thoroughly. Add X µL (per manufacturer's guideline for your sample volume) to a clean spin column.
- Bind: Mix crude DNA extract with an equal volume of binding buffer. Load the entire mixture onto the resin bed.
- Incubate & Centrifuge: Let stand at room temperature for 5 minutes. Centrifuge at 10,000 x g for 2 minutes.
- Collect: The flow-through contains purified DNA ready for qPCR setup.
The Scientist's Toolkit: Research Reagent Solutions
| Item | Function in ARG Transfer Sample Prep |
|---|---|
| Polyethersulfone (PES) Filters | Low-protein-binding membrane for biomass concentration; minimizes adhesion of extracellular DNA and inhibitors. |
| Inhibitor Removal Resin (e.g., PVP, PTB) | Chemical adsorption of polyphenolics, humic/fulvic acids, and polysaccharides from sample lysates. |
| Bead-Beating Matrix (Zirconia/Silica beads) | Mechanical lysis of robust bacterial cells (including Gram-positives) to ensure equal access to ARG targets. |
| PCR Inhibitor-Robust Polymerase Mix | Engineered polymerase/buffer systems (e.g., for "difficult" templates) to withstand trace inhibitors in final eluate. |
| Synthetic Spike-In DNA Control | Non-native DNA sequence added post-lysis to monitor and normalize for purification efficiency and inhibition. |
| DNase/RNase-Free TE Buffer (pH 8.0) | Stabilizes purified DNA during wash steps and storage; EDTA chelates Mg2+ to prevent nuclease activity. |
Visualized Workflows & Pathways
Optimized Sample Prep Workflow for ARG Detection
Troubleshooting qPCR Inhibition vs. Yield
Technical Support Center
Troubleshooting Guide & FAQs
Q1: My qPCR assay for detecting low-frequency antibiotic resistance gene (ARG) transfer events has high Ct values and inconsistent replicates. What could be wrong with my primers?
A: This is a common issue in low-copy-number detection. Primers must be exquisitely specific and efficient.
- Problem: Non-specific binding or primer-dimer formation consumes reagents, leading to inefficient amplification of the true low-abundance target.
- Solution:
- Re-analyze Primer Design: Use tools like Primer-BLAST against the specific ARG sequence and host genome to check for off-target binding. Ensure amplicon length is 80-150 bp for optimal qPCR efficiency.
- Optimize Annealing Temperature: Perform a temperature gradient qPCR (e.g., 58°C to 65°C) to identify the temperature yielding the lowest Ct and highest fluorescence (Rn) with no primer-dimers.
- Validate Primer Efficiency: Run a standard curve with a known template (serial 10-fold dilutions). Efficiency should be 90-110%, with an R² > 0.99. See Table 1.
Q2: I am testing environmental samples for ARG transfer. My PCR fails or the qPCR curve is abnormal. Are inhibitors to blame?
A: Yes, co-extracted compounds (e.g., humic acids, polysaccharides, salts) from complex samples are a major hurdle.
- Problem: Inhibitors can degrade enzymes, interfere with fluorescence, or bind nucleic acids.
- Solution:
- Sample Dilution: A simple 1:5 or 1:10 dilution of the DNA template can reduce inhibitor concentration below a critical threshold.
- Use Inhibitor-Tolerant Master Mixes: Employ commercial mixes containing polymerases and buffers designed for inhibitor tolerance (e.g., with bovine serum albumin or specialized polymerases).
- Internal Controls: Spike samples with a known amount of exogenous control DNA. A significant delay in its Ct compared to a clean sample confirms inhibition.
- Purification: Use cleanup kits designed for challenging samples (e.g., silica-column based with inhibitor-removal wash steps).
Q3: How should I adjust standard PCR cycling conditions when amplifying a large ARG fragment (>5 kb) from potential transposons or plasmids?
A: Long-range PCR requires conditions that maintain polymerase processivity and fidelity.
- Problem: Standard Taq polymerase has low processivity, leading to incomplete or failed amplification of long fragments.
- Solution:
- Specialized Enzyme: Use a high-fidelity, long-range PCR mix (e.g., blends containing Pfu or Phi29 polymerases).
- Extended Elongation Time: Calculate elongation time as 60-90 seconds per kilobase, depending on the enzyme's speed.
- Modified Cycling: Often a "two-step" PCR (combined annealing/extension at 68-72°C) is more effective than three-step. Use fewer cycles (25-30) to reduce error accumulation. See Table 2.
Q4: My melt curve analysis after qPCR for ARG variants shows multiple peaks. What does this mean and how do I resolve it?
A: Multiple peaks indicate non-specific amplification or primer-dimer artifacts, which is critical to resolve for specific detection.
- Problem: The assay is not specific, risking false positives in transfer detection.
- Solution:
- Optimize Primers: See Q1. Re-design primers if necessary, ensuring they are on exon-exon junctions if amplifying from cDNA.
- Hot-Start Polymerase: Use a hot-start Taq to prevent activity during setup, reducing primer-dimer formation.
- Increase Annealing Temperature: Incrementally increase the temperature by 1-2°C to enhance stringency.
- Adjust Mg²⁺ Concentration: Lower Mg²⁺ concentration can increase stringency. Test a range (e.g., 1.5 mM to 3.5 mM).
Data Tables
Table 1: Optimal vs. Sub-Optimal Primer Performance Metrics for Low-Copy ARG Detection
| Metric | Optimal Range | Sub-Optimal Value | Implication for Low-Frequency ARG Detection |
|---|---|---|---|
| Primer Efficiency (from std curve) | 90% - 110% | < 80% or > 120% | Inaccurate quantification; low-copy targets may be undetected. |
| R² (from std curve) | > 0.995 | < 0.980 | Poor linearity, unreliable quantification across dynamic range. |
| ΔRn (Fluorescence signal) | > 1.0 | < 0.5 | Weak signal, low signal-to-noise for rare targets. |
| Melt Curve Peaks | Single, sharp peak | Multiple or broad peaks | Non-specific amplification; risk of false positives. |
Table 2: Recommended Cycling Conditions for Different PCR Applications in ARG Research
| Application | Denaturation | Annealing | Extension | Cycles | Key Consideration |
|---|---|---|---|---|---|
| Standard ARG PCR (500 bp) | 95°C, 15-30 sec | 58-62°C*, 30 sec | 72°C, 45 sec | 30-35 | *Optimize with gradient. |
| High-Resolution Melt (HRM) qPCR | 95°C, 10 sec | 60°C*, 30 sec | 72°C, 20 sec (acquire) | 40-45 | Saturation dye required; post-run melt from 65°C to 95°C. |
| Long-Range ARG/Plasmid PCR | 98°C, 10 sec | 65°C*, 30 sec | 68°C, 90 sec/kb | 25-30 | Use specialized long-range enzyme mix. |
| Inhibitor-Tolerant qPCR | 95°C, 15 sec | 60°C, 30-60 sec | 72°C, 30 sec | 40-45 | Use master mix with inhibitor-resistant polymerase. |
Experimental Protocols
Protocol 1: qPCR Standard Curve and Efficiency Calculation for ARG Quantification
- Template Preparation: Create a 10-fold serial dilution (e.g., 10⁶ to 10¹ copies/µL) of a plasmid containing the cloned ARG target.
- qPCR Setup: In triplicate, combine 2-5 µL of each dilution with a master mix containing hot-start polymerase, dNTPs, MgCl₂, SYBR Green dye, and sequence-specific primers.
- Cycling: Run on a real-time cycler: Initial denaturation (95°C for 3 min); 40 cycles of [95°C for 15 sec, optimized Ta from gradient for 30 sec, 72°C for 30 sec (data acquisition)]; followed by a melt curve stage.
- Analysis: The instrument software plots Ct vs. log(starting quantity). The slope of the line is used to calculate efficiency: Efficiency (%) = [10^(-1/slope) - 1] * 100%.
Protocol 2: Inhibitor Spike-and-Recovery Test for Environmental DNA Samples
- Spike Preparation: Aliquot a constant, known amount of purified target ARG DNA (e.g., 10⁴ copies) into multiple tubes.
- Sample Addition: To these tubes, add varying volumes (e.g., 1 µL, 2 µL, 5 µL) of the extracted environmental DNA sample suspected to contain inhibitors. Include a control with nuclease-free water only.
- qPCR Run: Perform qPCR for the ARG target on all spiked samples and the control.
- Calculation: Compare the Ct value of the spiked samples to the water control. A delay of > 1 Ct indicates significant inhibition. The percent recovery can be calculated from the quantified copy number.
Visualizations
Title: Workflow for Low-Frequency ARG Detection Optimization
Title: PCR Inhibition Mechanisms and Mitigation
The Scientist's Toolkit: Research Reagent Solutions
| Reagent/Material | Function in Optimization | Key Consideration for Low-Frequency ARG Detection |
|---|---|---|
| Hot-Start High-Fidelity DNA Polymerase | Prevents non-specific amplification during setup; reduces errors in sequence. | Critical for accuracy when amplifying rare variants or long templates from complex samples. |
| SYBR Green or HRM Dye | Intercalates into dsDNA for real-time detection (SYBR) or high-resolution melt analysis (HRM). | SYBR requires pristine specificity. HRM allows discrimination of ARG variants post-PCR. |
| Inhibitor-Tolerant Master Mix | Contains additives (BSA, trehalose) and engineered enzymes to withstand common inhibitors. | Essential for reliable results from environmental (soil, wastewater) or clinical (blood, stool) samples. |
| Nuclease-Free Water & Tubes | Provides a sterile, RNase/DNase-free environment for reaction assembly. | Contamination control is paramount when detecting low-copy targets. |
| Digital PCR Master Mix & Chips | Enables absolute quantification without a standard curve by partitioning samples. | Emerging gold standard for ultra-sensitive, precise quantification of rare ARG transfer events. |
| Primer Design Software (e.g., Primer-BLAST) | Ensures primer specificity against comprehensive databases. | The first and most critical step to avoid off-target amplification and false signals. |
Mitigating Background Noise and False Positives in Sequencing-Based Assays
Troubleshooting Guides & FAQs
Q1: Our negative controls (no-template or no-donor) show unexpected amplification and sequencing reads. What are the primary sources of this contamination and how can we eliminate them?
A: This is a classic sign of amplicon or sample cross-contamination. Key sources and mitigations include:
- Post-amplification Contamination: Amplicons from previous runs aerosolize and contaminate pre-PCR areas.
- Solution: Implement strict unidirectional workflow. Use physically separated, dedicated rooms or cabinets for pre-PCR (clean) and post-PCR (dirty) work. Use UV irradiation in hoods and dedicated equipment.
- Reagent Contamination: Enzymes, water, or buffers contaminated with environmental DNA or previous amplicons.
- Solution: Aliquot all reagents upon receipt. Use high-quality, sequencing-grade, nuclease-free reagents. Include multiple negative controls (extraction, PCR, library prep).
- Index Hopping or Misassignment: In multiplexed runs, reads are incorrectly assigned to a sample due to index cross-talk.
- Solution: Use unique dual indexing (UDI) with dual-matched adapters. Increase index diversity and utilize bioinformatics tools with error-correcting code-aware demultiplexing.
Q2: We observe consistent, low-level false-positive ARG detection across replicates that does not scale with input. What could cause this?
A: This pattern suggests systematic background, often from:
- Oligonucleotide Carryover: Trace amounts of primers/probes from synthesis or previous experiments.
- Solution: Treat all oligonucleotide stocks and working solutions with a DNase (like UNG, uracil-N-glycosylase) prior to PCR if using dUTP incorporation. Perform cartridge-based or gel purification of primers.
- Non-Specific Amplification: Primers binding to non-target sequences under suboptimal conditions.
- Solution: Optimize annealing temperature using a gradient PCR. Increase primer specificity and length. Use touchdown PCR or hot-start enzymes. Verify primer specificity with in silico PCR (e.g., using
primerBLAST).
- Solution: Optimize annealing temperature using a gradient PCR. Increase primer specificity and length. Use touchdown PCR or hot-start enzymes. Verify primer specificity with in silico PCR (e.g., using
- Host DNA Homology: Primers may have partial complementarity to host (e.g., gut microbiome, eukaryotic) DNA.
- Solution: Perform careful in silico alignment of all primer sequences against the host genome and expected microbial background. Redesign primers if necessary.
Q3: How do we distinguish true low-frequency horizontal gene transfer (HGT) events from sequencing errors or chimeric reads?
A: This is a central challenge. A multi-layered validation protocol is required.
Experimental Protocol: Validation of Putative Low-Frequency HGT Events
- Primary Enrichment & Sequencing: Perform conjugation or transformation assay. Extract total community DNA. Perform PCR enrichment targeting the ARG-flanking junction (using primers specific to the ARG and a conserved region of the suspected plasmid/chromosome). Use a high-fidelity polymerase (e.g., Q5, Phusion). Sequence with Illumina MiSeq (2x300bp) or PacBio HiFi for longer reads.
- Bioinformatic Filtering:
- Error Suppression: Use tools like
DADA2orDeblurfor amplicon sequences, which model and correct Illumina errors. - Chimera Removal: Apply stringent chimera checking (
UCHIME,vsearch). - Consensus Threshold: Require a variant to be present in ≥2 independent PCR replicates and at a frequency >0.01% (above expected error rate).
- Error Suppression: Use tools like
- Independent Validation:
- Digital Droplet PCR (ddPCR): Design TaqMan probes spanning the exact ARG-insertion junction. Use the original, non-amplified genomic DNA. This provides absolute, amplification-bias-free quantification.
- Long-Read Sequencing: Subject DNA from the enrichment culture to Oxford Nanopore or PacBio sequencing to physically link the ARG to its genomic context without assembly.
Q4: Library preparation introduces biases that inflate background. Which methods minimize this for low-abundance target detection?
A: The choice of polymerase and library kit is critical.
Table 1: Comparison of High-Fidelity Polymerases for Low-Biomass Amplification
| Polymerase | Error Rate (mutations/bp) | Key Feature for Noise Reduction | Best for |
|---|---|---|---|
| Q5 High-Fidelity | ~1 in 1,000,000 | Ultra-high fidelity, hot-start | Primary target enrichment PCR |
| Phusion Plus | ~1 in 1,000,000 | High fidelity, fast cycling | Amplicon generation for sequencing |
| KAPA HiFi HotStart | ~1 in 1,000,000 | Robust amplification from complex samples, good for GC-rich targets | Whole genome amplification prior to ARG screening |
| Platinum SuperFi II | ~1 in 2,000,000 | Exceptional specificity for difficult amplicons | Amplifying ARGs with high host background |
Protocol: Low-Bias Metagenomic Library Prep for ARG Screening
- DNA Input: Use ≥10ng of input DNA to avoid stochastic amplification bias.
- Fragmentation: Use enzymatic (e.g., Nextera) or focused-ultrasonication (Covaris) over mechanical shearing for low input.
- Library Kit: Use kits designed for low-input and low-bias, such as NEBNext Ultra II FS DNA Library Kit (incorporates fragmentation and size selection) or Swift Accel-NGS 2S Plus.
- PCR Cycles: Minimize the number of amplification cycles during library prep (≤12 cycles). Use unique dual indexes.
- Size Selection: Perform double-sided size selection (SPRI beads) to remove short fragments and primer dimers that contribute to noise.
The Scientist's Toolkit: Key Research Reagent Solutions
Table 2: Essential Materials for Low-Frequency ARG Transfer Detection
| Item | Function & Rationale |
|---|---|
| Uracil-N-Glycosylase (UNG) | Enzymatically degrades uracil-containing DNA (from previous dUTP-incorporated PCRs), preventing carryover contamination. |
| Unique Dual Index (UDI) Kits | Minimizes index hopping and sample misassignment in multiplexed NGS runs, critical for accurate low-variant calling. |
| High-Fidelity Polymerase (Q5/Phusion) | Ultra-low error rate reduces introduction of sequencing errors mistaken for true genetic variation. |
| ddPCR Supermix (Bio-Rad QX200) | Enables absolute quantification of specific ARG junctions without amplification bias; gold standard for validating NGS findings. |
| PCR Decontamination Reagent (DNA-ExitusPlus) | Used to treat workspaces and equipment to hydrolyze contaminating DNA into short fragments. |
| SPRIselect Beads | For precise size selection of libraries, removing adapter dimers and short non-specific products that cause background noise. |
| Precision Glycerol Stocks | For maintaining consistent, contamination-free stocks of donor/recipient bacterial strains. |
| Plasmid-Safe ATP-Dependent DNase | Digests linear chromosomal DNA but not circular plasmids, enriching for plasmid DNA prior to screening for transferred ARGs. |
Experimental Workflow Diagrams
Workflow for Detecting & Validating Low-Frequency ARG Transfer
Noise Sources and Mitigation Pathways in Sequencing Assays
Troubleshooting & FAQs: Optimizing Detection of Low-Frequency Antibiotic Resistance Gene Transfer
This technical support center addresses common challenges in experiments designed to detect rare horizontal gene transfer (HGT) events of antibiotic resistance genes (ARGs), framed within the thesis of optimizing their detection.
Frequently Asked Questions
Q1: My positive control (high-frequency transfer) works, but I cannot detect any low-frequency transfer events in my experimental setup. What could be wrong? A: This typically indicates insufficient selective pressure or an imbalance that favors growth of the recipient background over transconjugants. First, verify the minimum inhibitory concentration (MIC) of the selective antibiotic for both the donor and recipient strains individually on the mating medium. The selective pressure must completely inhibit the recipient but allow growth of transconjugants. For low-frequency events, consider using a dual or counter-selection system (e.g., using antibiotics plus a chromosomal marker like rpsL or sacB) to more effectively suppress the recipient population.
Q2: I observe high background growth on my selection plates, swamping potential transconjugant colonies. How can I reduce this? A: High background is often due to carryover of donors or spontaneous resistance in recipients.
- Solution A (Donor Carryover): Include a selective agent in the mating plate that inhibits the donor strain (e.g., an antibiotic to which the recipient is resistant but the donor is not). Use a washing step after mating and plate on media containing both donor- and recipient-inhibiting agents.
- Solution B (Recipient Background): Re-titrate the antibiotic concentration. Consider using a minimal medium that restricts background growth if your strains allow it. Implement a "mating-assay" control where you plate the recipient alone on the selection plates to check for spontaneous resistance frequency.
Q3: How do I choose the optimal antibiotic concentration for selective plates when detecting rare transfer events? A: The concentration must be biologically relevant yet sufficiently stringent. Follow this protocol:
- Perform a killing curve assay for both donor and recipient.
- Determine the MIC that inhibits 99.9% of the recipient population.
- Use a concentration 1.5x to 2x this MIC on your final selection plates. Avoid concentrations vastly exceeding clinical resistance breakpoints, as this reduces biological relevance and may miss some mechanisms.
Q4: My calculated transfer frequency seems artificially high/low. How can I normalize my data accurately?
A: Standardize your calculation. The canonical formula is:
Transfer Frequency = (Number of Transconjugants) / (Number of Recipient Cells at End of Mating).
A common error is using the initial recipient count. Use plate counts of recipients on non-selective media after the mating period to determine the final recipient titer. Always run experiments in biological triplicate.
Key Experimental Protocols
Protocol 1: Determination of Optimal Selective Pressure for Filter Mating Assays
- Objective: To establish the antibiotic concentration that maximizes transconjugant recovery while minimizing background.
- Materials: Donor and recipient strains, LB broth and agar, sterile filters, mating plates, antibiotic stock solutions.
- Method:
- Grow donor and recipient cultures to mid-exponential phase.
- Mix at a defined ratio (e.g., 1 donor:10 recipient) and concentrate.
- Spot mixture onto a sterile membrane filter placed on a non-selective agar plate. Incubate for mating (e.g., 2-4h, 37°C).
- Resuspend cells from the filter and perform serial dilutions.
- Plate on media containing gradients of the selective antibiotic (see table below for example). Also plate controls for donor and recipient viability.
- Count colonies after 24-48h. The optimal concentration is the lowest that yields zero background recipient colonies while maximizing transconjugant counts.
Protocol 2: Liquid Mating with Counter-Selection for Ultra-Sensitive Detection
- Objective: To enrich for and detect very low-frequency transfer events (<10^-8).
- Method:
- Perform liquid mating in a rich, non-selective broth.
- After mating, transfer a portion of the culture to a fresh broth containing antibiotics that selectively inhibit the donor and slowly inhibit the recipient, while allowing transconjugant growth (e.g., a sub-MIC of a recipient-inhibitor plus a full MIC of a donor-inhibitor).
- Incubate for 18-24h to allow enrichment of transconjugants.
- Plate on solid media with stringent selection to isolate individual transconjugant colonies.
- Note: This enrichment step can bias results and should be reported alongside direct plating data.
Table 1: Example Antibiotic Titration for Selection of blaCTX-M-15 Transconjugants
| Antibiotic (Cefotaxime) Concentration (µg/mL) | Recipient E. coli J53 Background CFU | Donor E. coli MG1655(pCTX-M-15) CFU | Transconjugant CFU (J53+pCTX-M-15) | Recommended Use |
|---|---|---|---|---|
| 0.5 | 5.2 x 10^5 | 0 | 1.1 x 10^3 | Low-stringency |
| 1.0 | 1.0 x 10^2 | 0 | 8.9 x 10^2 | Optimal |
| 2.0 | 0 | 0 | 5.4 x 10^2 | High-stringency |
| 5.0 | 0 | 0 | 1.5 x 10^1 | May undercount |
Table 2: Impact of Selective Pressure Stringency on Reported Transfer Frequencies
| Selection Condition | Calculated Transfer Frequency | Biological Relevance (Proximity to Clinical MIC) | Risk of Artefactual Enrichment |
|---|---|---|---|
| Sub-MIC (0.25x MIC_Recipient) | 4.7 x 10^-4 | High | High (false positives) |
| Standard MIC (1x MIC_Recipient) | 2.1 x 10^-5 | High | Low |
| Clinical Breakpoint (e.g., 2 µg/mL Cefotaxime) | 8.3 x 10^-6 | Very High | Low |
| Supra-MIC (10x MIC_Recipient) | <1.0 x 10^-8 | Low | High (false negatives) |
Visualizations
Title: Workflow for Low-Frequency ARG Transfer Assay
Title: Balancing Selection: Enrichment vs. Relevance
The Scientist's Toolkit: Research Reagent Solutions
| Item | Function in Low-Frequency ARG Transfer Research |
|---|---|
| Chromosomal Counterselection Markers (e.g., rpsL, sacB) | Enables selective growth of transconjugants by exploiting donor/recipient genetic differences without relying solely on antibiotics. |
| Gradient Agar Plates | Allows empirical determination of the optimal antibiotic concentration for selection in a single experiment. |
| Membrane Filters (0.22µm) | Provides a solid surface for bacterial conjugation in filter mating assays, standardizing cell-to-cell contact. |
| Clinical Breakpoint Strips (e.g., Etest) | Tools to quickly determine the MIC of an antibiotic for a bacterial strain, linking lab selection to clinical relevance. |
| Neutralizing Agents (e.g., β-lactamase inhibitors) | Added to recovery media to stop antibiotic action after mating, preventing carryover effects that kill transconjugants. |
| Viable-but-Non-Culturable (VBNC) Dye Assays (e.g., PMA-qPCR) | Helps distinguish between true gene transfer and passive DNA uptake/ persistence in a non-culturable state. |
Standardizing Controls and Replicates for Statistical Confidence in Rare Events
Technical Support Center
Troubleshooting Guides & FAQs
Q1: In our conjugation assay for low-frequency ARG transfer, we consistently get zero transconjugants on our selective plates, despite positive donor and recipient controls. What could be wrong? A: This is a common issue in rare event detection. Follow this systematic checklist:
- Antibiotic Concentration: Verify the minimum inhibitory concentration (MIC) for the recipient and transconjugant. The selective plate must use an antibiotic concentration that fully inhibits the recipient but allows transconjugants (carrying the ARG) to grow. Re-run MIC assays for all strains.
- Plate Incubation Time: Rare events require extended incubation. Do not discard plates at 24 hours. Incubate for 48-72 hours and re-examine.
- Mating Conditions: Ensure the donor/recipient ratio is optimized (e.g., 1:10). Increase the total volume of the mating mixture plated. Consider using filter mating (see Protocol 1) over liquid mating for closer cell contact.
- Viability Control: Perform a serial dilution and spot assay of the mating mixture on non-selective media to confirm cell viability post-mating.
Q2: Our negative control plates (recipient-only) occasionally show background growth, ruining our counts. How do we resolve this? A: Background growth in negative controls invalidates the experiment. Solutions include:
- Increased Antibiotic Selective Pressure: Immediately prepare fresh antibiotic stocks and confirm concentration in plates. Consider increasing the antibiotic concentration by 1.5x, but first confirm it does not inhibit transconjugants.
- Alternative Counterselection: If using a single antibiotic, implement dual counterselection (e.g., antibiotic resistance + auxotrophy or a second antibiotic). This drastically reduces escapee frequency.
- Strain Purity: Re-streak and re-isolate your recipient strain from a frozen stock to ensure it has not acquired contaminating resistance.
Q3: How many biological replicates are statistically sufficient for rare ARG transfer frequency calculations? A: The required replicates depend on the expected frequency and desired confidence interval. Use the table below as a guideline. For frequencies <10⁻⁸, consider using a maximum likelihood estimation (MLE) approach rather than simple proportion, as it better handles zero-event replicates.
Table 1: Replicate Guidance for Rare Event Detection
| Expected Transfer Frequency | Minimum Recommended Biological Replicates | Suggested Statistical Method | Key Rationale |
|---|---|---|---|
| >10⁻⁴ | 3 | Mean ± Standard Deviation | Normal distribution approximation valid. |
| 10⁻⁶ to 10⁻⁴ | 5-7 | Mean with 95% CI (Poisson) | Accounts for count data skew. |
| <10⁻⁶ | 9-12 | Maximum Likelihood Estimation (MLE) | Robustly handles zero-count replicates. |
Q4: What are the essential controls for every conjugation experiment, and what does each one signify? A: The following panel of controls is non-negotiable for interpretable data.
Table 2: Mandatory Experimental Controls Panel
| Control Plate Type | Cells Plated | Selective Antibiotics | Purpose & Interpretation of Growth |
|---|---|---|---|
| Donor Viability | Donor only | Donor-selective (e.g., for chromosomal marker) | Confirms donor is viable and countable. |
| Recipient Viability | Recipient only | Recipient-selective | Confirms recipient is viable and countable. |
| Negative Control | Recipient only | Transconjugant-selective (e.g., ARG antibiotic) | Must show no growth. Confirms selectivity. |
| Positive Control | Known transconjugant or donor + recipient mix | Transconjugant-selective | Validates that selective media supports transconjugant growth. |
| Spontaneous Resistance | Recipient only (high density) | Transconjugant-selective | Quantifies recipient mutation rate to antibiotic resistance. |
Experimental Protocols
Protocol 1: Standardized Filter Mating for Conjugation Assay
- Objective: To quantify the transfer frequency of a low-frequency ARG between bacterial strains.
- Materials: Donor strain, Recipient strain, 0.22µm sterile membrane filters, LB agar plates, selective agar plates with appropriate antibiotics, phosphate-buffered saline (PBS).
- Method:
- Grow donor and recipient cultures to mid-exponential phase (OD₆₀₀ ≈ 0.5).
- Mix donor and recipient cells at a standardized ratio (e.g., 1 donor:10 recipient) in a final volume of 1 mL PBS. Perform serial dilutions to plate for donor and recipient viability counts (on their respective selective media).
- Pipette 200µL of the mixture onto a sterile membrane filter placed on a non-selective LB agar plate.
- Incubate for 18 hours at optimal growth temperature.
- After incubation, transfer the filter to a tube with 5 mL PBS and vortex vigorously to resuspend cells.
- Plate serial dilutions of the resuspended cells onto agar plates selective for transconjugants (e.g., containing antibiotics that inhibit donor and recipient but allow transconjugants).
- Plate appropriate dilutions on donor- and recipient-selective media to determine final population densities.
- Incubate transconjugant plates for 48-72 hours before counting colonies.
- Calculation: Transfer Frequency = (Number of Transconjugants) / (Number of Recipients at end of mating).
Protocol 2: Most Probable Number (MPN) Method for Very Low Frequency Events
- Objective: To detect ARG transfer events below the limit of direct plating (<10⁻⁸).
- Method:
- Perform mating as in Protocol 1.
- Instead of plating dilutions on solid selective media, inoculate a series of 10 replicate liquid cultures (e.g., in 96-well deep-well plates) with a high density of the mating mixture resuspension (e.g., 10⁷ cells per well) in broth with transconjugant-selective antibiotics.
- Incubate with shaking for 48 hours.
- Score each well for growth/turbidity. A positive well indicates at least one initial transconjugant was present.
- Use MPN statistical tables or calculators to estimate the original transconjugant concentration in the mating resuspension based on the pattern of positive and negative wells.
Visualizations
Title: Rare Event ARG Transfer Experimental & Troubleshooting Workflow
Title: Conjugation Pathway & Selection for ARG Transfer
The Scientist's Toolkit: Research Reagent Solutions
Table 3: Essential Materials for Rare Event ARG Transfer Studies
| Item | Function & Importance for Rare Events | Example/Notes |
|---|---|---|
| Chromosomal Counterselectable Markers | Enables clean counterselection of donor and recipient, reducing background on selective plates. Critical for frequency <10⁻⁶. | SacB (sucrose sensitivity), rpsL (streptomycin sensitivity), or dual antibiotic resistance. |
| Fresh Antibiotic Stock Solutions | Prevents degradation of selective agents which leads to background growth. Aliquot and store at -20°C. | Make fresh stocks monthly for critical antibiotics like carbapenems. |
| 0.22µm Polycarbonate Membrane Filters | For filter mating. Provides consistent cell-to-cell contact across replicates. | Superior to nitrocellulose for easy cell resuspension. |
| Automated Colony Counter | Reduces human counting error and bias, especially for plates with high background or micro-colonies. | Essential for high-throughput replicate analysis. |
| Statistical Software (Poisson/MLE capable) | Accurate calculation of confidence intervals for count data and low/zero event datasets. | R (stats4 package for MLE), GraphPad Prism. |
| Deep-Well Microtiter Plates | For MPN assays in liquid culture to detect frequencies below plating limit. | Allows processing of many replicate cultures efficiently. |
Benchmarking Detection Assays: Validation, Reproducibility, and Comparative Analysis
Establishing Gold Standards and Reference Materials for Low-Frequency Transfer
Technical Support Center: Troubleshooting Low-Frequency ARG Transfer Detection
FAQs & Troubleshooting Guides
Q1: Our negative controls are consistently showing false-positive signals in the PCR-based detection of plasmid transfer events. What could be the cause? A: This is often due to aerosol or cross-contamination of samples with plasmid DNA or donor cells. Implement the following:
- Physical Separation: Perform pre-PCR (sample processing, DNA extraction) and post-PCR (analysis) work in separate, dedicated rooms or enclosures.
- UVP Treatment: Treat all work surfaces and equipment with ultraviolet light (UVP) prior to use.
- No-Template Controls (NTCs): Include multiple NTCs at both the DNA extraction and PCR amplification steps to pinpoint the contamination source.
- Enzymatic Prevention: Use uracil-DNA glycosylase (UDG) and dUTP in PCR mixes to carryover amplicon contamination.
Q2: The transfer frequency we are measuring is highly variable between technical replicates, even with our reference donor/recipient pair. A: High variability at low frequency often stems from inconsistent cell states or mixing.
- Ensure Exponential Growth: Culture donor and recipient cells to mid-exponential phase (OD~0.4-0.6) separately, then wash and resuspend in fresh, pre-warmed medium before mating.
- Standardize Mixing: Use a defined vortexing protocol (e.g., 10 seconds at medium power) after combining cells, and ensure mating aggregates are gently but fully resuspended prior to serial dilution and plating.
- Increase Biological Replicates: For low-frequency events (<10^-6), perform at least 6-8 independent mating assays per condition to obtain statistically robust data.
Q3: Our reference material (a characterized plasmid in a defined host) shows a significant drop in transfer frequency upon thawing from a frozen stock. A: This indicates loss of plasmid during freezing or outgrowth.
- Use Plasmid-Stabilizing Media: Always include the appropriate selective antibiotic in the growth medium when reviving the frozen stock.
- Check Plasmid Retention: Plate revived cultures on both selective (for plasmid) and non-selective media. The colony count should be similar; if not, re-streak from a colony on selective media to obtain a stable culture.
- Prepare Fresh Glycerol Stocks: Create new, high-quality reference stocks from a confirmed plasmid-positive culture in mid-exponential phase, using a final glycerol concentration of 15-25%.
Q4: When using fluorescent markers for flow cytometry-based conjugation detection, the background signal from autofluorescent debris is too high. A: This compromises the detection of rare transfer events.
- Enhanced Gating: Use a combination of FSC-A/SSC-A to gate on cells, then FSC-A/FSC-H to exclude doublets. Apply a viability dye (e.g., propidium iodide) to gate exclusively on intact recipient cells before analyzing for the fluorescent marker signal.
- Differential Labeling: Label donor and recipient cells with two distinct, bright fluorescent proteins (e.g., GFP and mCherry). A true transconjugant will be double-positive, which significantly reduces false positives from debris.
- Filter Samples: Pass the sample through a low-protein-binding 5µm filter before analysis to remove large aggregates and debris.
Experimental Protocol: Standardized Filter Mating Assay for Reference Material Validation
Objective: To quantify the conjugation frequency of a reference plasmid (e.g., RP4) from a defined donor (E. coli HB101) to a defined recipient (E. coli MG1655 Rif^R).
Materials:
- Donor: E. coli HB101(pRP4) (Kan^R)
- Recipient: E. coli MG1655 Rif^R
- LB broth and LB agar plates
- Selective agar plates: LB + Kanamycin (50 µg/mL) + Rifampicin (100 µg/mL) for transconjugants; LB + Kanamycin (50 µg/mL) for donors; LB + Rifampicin (100 µg/mL) for recipients.
- Sterile 0.85% NaCl solution, pre-warmed.
- Nitrocellulose membrane filters (0.22µm pore size, 25mm diameter).
- Sterile forceps.
Methodology:
- Grow donor and recipient cultures separately in 5mL LB with appropriate antibiotics overnight at 37°C with shaking (200 rpm).
- Subculture 1:100 into fresh, pre-warmed LB without antibiotics and grow to mid-exponential phase (OD600 ~0.5).
- Wash cells twice by centrifuging 1mL of each culture at 8,000 x g for 2 min and resuspending in 1mL pre-warmed 0.85% NaCl.
- Mix 100µL of donor and 900µL of recipient suspension (1:9 ratio) in a microcentrifuge tube. Vortex for 10 seconds.
- Pipette the 1mL mixture onto a sterile nitrocellulose filter placed on a pre-warmed LB agar plate (no antibiotics). Incubate for 90 minutes at 37°C.
- Transfer the filter to a tube with 1mL of 0.85% NaCl. Vortex vigorously for 1 minute to resuspend cells.
- Perform serial 10-fold dilutions in 0.85% NaCl.
- Plate 100µL of appropriate dilutions (typically 10^0, 10^-2, 10^-4) onto the three selective agar plate types. Plate in technical duplicate.
- Incubate plates at 37°C for 24-36 hours.
- Count colonies and calculate transfer frequency: CFU per mL on transconjugant plates / CFU per mL on recipient plates.
Data Presentation
Table 1: Expected Performance Range for RP4 Reference Material in Filter Mating
| Parameter | Specification | Acceptable Range | Notes |
|---|---|---|---|
| Donor Titer | E. coli HB101(pRP4) | 1-5 x 10^8 CFU/mL | Pre-mating, on Kanamycin |
| Recipient Titer | E. coli MG1655 Rif^R | 1-5 x 10^8 CFU/mL | Pre-mating, on Rifampicin |
| Baseline Transfer Frequency | Conjugation efficiency | 1 x 10^-4 to 5 x 10^-4 | 90-min filter mating, 37°C |
| Negative Control Signal | Growth on T/R selection | 0 CFU | Validates selectivity |
| Assay CV (Technical Replicates) | Coefficient of Variation | < 20% | For n=6 within an experiment |
Table 2: Troubleshooting Matrix for Common Issues
| Symptom | Possible Cause | Recommended Action |
|---|---|---|
| Zero transconjugants | Antibiotic selection failure | Verify antibiotic stock activity and plate concentration. |
| High negative control growth | Contaminated selective agents | Prepare fresh antibiotic plates. |
| Transfer frequency too low | Cells not in log phase | Re-grow cultures, ensure OD600 ~0.5 at mixing. |
| Unusually high frequency | Donor overgrowth on selective plate | Use counter-selection (e.g., streptomycin) for recipient or perform PCR validation. |
| High replicate variability | Inconsistent cell resuspension | Standardize vortexing and pipetting protocol. |
Visualizations
Diagram 1: Experimental Workflow for Gold Standard Transfer Assay
Diagram 2: Key Signaling Pathways in RP4 Plasmid Transfer (tra regulation)
The Scientist's Toolkit: Research Reagent Solutions
| Item | Function & Importance |
|---|---|
| Defined Strain Pair | E. coli HB101 (donor) and MG1655 Rif^R (recipient). Provides a genetically stable, non-pathogenic background with selectable markers for baseline measurements. |
| Reference Plasmid (RP4/RK2) | A broad-host-range, well-characterized IncPα plasmid. Serves as the positive control for conjugation apparatus function and establishes expected transfer frequency ranges. |
| Antibiotic Master Stocks | Prepared at high concentration (e.g., 50 mg/mL), aliquoted, and stored at -20°C. Ensures consistent selection pressure across experiments and batches. |
| Nitrocellulose Membrane Filters | Provide a solid, nutrient-permeable surface for cell-cell contact during mating. Pore size (0.22µm) retains bacteria while allowing medium diffusion. |
| Fluorescent Protein Markers | Plasmid-borne GFP and chromosome-integrated mCherry. Enables sensitive, high-throughput flow cytometry detection of rare transfer events without selection. |
| Digital PCR (dPCR) Master Mix | Allows absolute quantification of plasmid copies in a background of chromosomal DNA. Critical for validating copy number in reference materials and detecting very low-frequency transfer. |
| Synthetic Mating Medium | A defined, minimal medium (e.g., M9). Reduces background growth and variable gene expression, improving assay reproducibility for mechanistic studies. |
Troubleshooting Guides & FAQs
Q1: Our qPCR assay for detecting a low-abundance antibiotic resistance gene (ARG) shows inconsistent Ct values near the assay's limit of detection. What could be the cause and how can we improve reliability? A1: Inconsistent Ct values near the LoD are common. This is often due to pipetting errors with low-concentration templates or suboptimal master mix homogeneity.
- Solution: Implement a strict digital PCR (dPCR) protocol for absolute quantification at these low levels. Prepare master mix in a large, single batch for the entire experiment to reduce variability. Include at least 8 technical replicates for each sample near the LoD. Use a fluorescence threshold that intersects the exponential phase of all your standard curves for consistent calling.
Q2: When quantifying ARG transfer frequencies over several orders of magnitude, my standard curve loses linearity at high concentrations. How do I maintain assay dynamic range? A2: Loss of linearity at high concentrations typically indicates PCR inhibition or detector saturation.
- Solution: For high-concentration samples, mandate a dilution series and re-amplify. This confirms results and corrects for inhibition. For plate reader-based assays (e.g., fluorescent reporters), ensure measurements are taken in the linear range of the detector by performing a signal saturation test beforehand. Switching to a assay chemistry designed for broad dynamic range (e.g., some probe-based chemistries) may be necessary.
Q3: Our high-throughput conjugation experiment screening requires processing hundreds of samples, but our current detection method is too slow. How can we increase throughput without sacrificing sensitivity for low-frequency transfer events? A3: The core challenge is balancing sensitivity with speed.
- Solution: Transition to a microtiter plate-based workflow. Utilize automated liquid handlers for sample plating and master mix dispensing. Implement a droplet digital PCR (ddPCR) protocol pre-validated for your target ARG. While the ddPCR run itself takes 2-3 hours, it allows for the simultaneous, replicate-free absolute quantification of 96 or 384 samples, dramatically increasing throughput compared to running sequential standard curves with qPCR.
Q4: How do I choose between qPCR and dPCR for my low-frequency ARG transfer experiment? A4: The choice hinges on the primary requirement.
- Use qPCR when you need high dynamic range, are measuring relatively high copy numbers, require melt curve analysis, or need speed for a large number of targets. It is less suitable for absolute quantification at the LoD.
- Use dPCR (especially ddPCR) when your primary need is absolute quantification at the LoD, you are working with very low copy numbers (<10 copies/μL), or your sample contains inhibitors that would skew qPCR results. It offers superior precision and sensitivity but has a narrower dynamic range and lower multiplexing capability.
Table 1: Comparison of Key Detection Metrics for Common Platforms
| Platform | Typical Limit of Detection (LoD) | Dynamic Range | Throughput (Samples/Day) | Best Use Case for ARG Transfer Studies |
|---|---|---|---|---|
| Standard qPCR | ~10-100 copies/reaction | 6-8 orders of magnitude | 96-384 (moderate) | Quantifying moderate-to-high frequency transfer; gene expression kinetics. |
| Droplet Digital PCR (ddPCR) | ~1-3 copies/reaction | 4-5 orders of magnitude | 96-384 (high) | Gold standard for low-frequency events. Absolute quantification of rare transconjugants. |
| Microbial Flow Cytometry | ~10⁴ cells/mL (for rare events) | 3-4 orders of magnitude | 1000s (very high) | Ultra-high-throughput screening of fluorescent reporter-tagged transfer in large populations. |
| Nanopore Sequencing | Varies with depth (~0.1% abundance) | Limited by read depth | 1-12 (low) | Identifying unknown ARGs and genetic context of transfer; not for precise quantification. |
Table 2: Optimization Reagent Solutions for Low-Frequency ARG Detection
| Reagent / Material | Function & Importance for Low-Frequency Detection |
|---|---|
| Inhibitor-Resistant Polymerase Mix | Critical for environmental or gut microbiome samples. Reduces false negatives from PCR inhibitors, ensuring true LoD is achieved. |
| ddPCR Supermix (for Probes) | Optimized for clean droplet formation and endpoint PCR, providing the partition stability required for absolute quantification at low copy numbers. |
| gDNA Removal Master Mix | Essential when detecting plasmid-borne ARG transfer via RNA/cDNA. Eliminates false-positive signals from contaminating genomic or plasmid DNA in RNA extracts. |
| Synthetic gDNA Blocks/Spike-ins | Used as an external control to monitor extraction efficiency and identify sample-specific inhibition, crucial for validating negative results near the LoD. |
| Membrane Filter (0.22 µm) for Matings | Standardizes conjugation assay conditions by ensuring consistent cell-to-cell contact, improving reproducibility of low-frequency transfer measurements. |
Detailed Experimental Protocols
Protocol 1: Droplet Digital PCR for Absolute Quantification of Low-Frequency ARG Transfer
Objective: To absolutely quantify the copy number of a specific ARG (e.g., blaCTX-M-15) in genomic DNA extracted from a conjugation mixture, determining transconjugant formation frequency.
Methodology:
- Sample Preparation: Perform a filter mating between donor (carrying ARG plasmid) and recipient strains. Resuspend cells, serially dilute, and plate on selective media to obtain a coarse frequency. In parallel, extract total genomic DNA from the resuspended mating mix using a kit with mechanical lysis (bead beating).
- ddPCR Reaction Setup: Prepare a 20µL reaction mix containing: 10µL of ddPCR Supermix for Probes (no dUTP), 1µL of forward and reverse primer (900 nM final), 0.25µL of FAM-labeled probe (250 nM final), 1µL of restriction enzyme (e.g., HindIII) to cut genomic DNA and reduce viscosity, and 7.75µL of template DNA (optimize amount, typically 10-100 ng).
- Droplet Generation: Load the reaction mix into a DG8 cartridge with 70µL of Droplet Generation Oil. Generate droplets using the droplet generator.
- PCR Amplification: Transfer 40µL of droplets to a 96-well PCR plate. Seal and run on a thermal cycler with a standard TaqMan probe protocol (e.g., 95°C for 10 min, 40 cycles of 94°C for 30s and 60°C for 60s, 98°C for 10min, 4°C hold).
- Droplet Reading & Analysis: Read the plate on a droplet reader. Use analysis software to set a fluorescence amplitude threshold to distinguish positive (FAM+) from negative droplets. The concentration (copies/µL) is calculated using Poisson statistics: ( C = -ln(1-p) \times (1/V) ), where ( p ) is the fraction of positive droplets and ( V ) is the droplet volume.
Protocol 2: High-Throughput Fluorescent Reporter-Based Conjugation Screen
Objective: To rapidly screen hundreds of conditions (e.g., inhibitor compounds) for their effect on plasmid conjugation frequency using a fluorescent reporter.
Methodology:
- Strain Engineering: Clone the ARG of interest into a plasmid backbone containing a constitutively expressed fluorescent protein (e.g., GFP). Transform into donor strain. Use a recipient strain expressing a different fluorescent protein (e.g., RFP) for ease of differentiation.
- Microtiter Plate Mating: Using an automated liquid handler, inoculate donors and recipients into 96-well deep-well plates containing different test compounds in broth. Allow conjugation to proceed for a set time (e.g., 2 hours).
- Flow Cytometry Preparation: Stop conjugation by adding dilution buffer. Transfer samples to a 96-well plate compatible with a plate sampler for a flow cytometer. Include a viability stain (e.g., propidium iodide) to gate on live cells.
- High-Throughput Flow Cytometry: Run samples using an automated sampler. Set gates on forward/side scatter for cells, then on donor (GFP+/RFP-), recipient (GFP-/RFP+), and transconjugant (GFP+/RFP+) populations.
- Data Analysis: Calculate conjugation frequency as (number of double-positive events) / (total number of recipient events). Normalize this frequency to the vehicle control condition for each plate.
Visualizations
Diagram 1: Workflow for Optimizing Low-Frequency ARG Detection
Diagram 2: Decision Logic for Selecting a Detection Platform
Technical Support Center: Troubleshooting Low-Frequency ARG Transfer Detection
FAQs & Troubleshooting Guides
Q1: In our cross-validation study, culture-based methods recover no resistant colonies, but targeted qPCR shows a positive signal for the ARG. What is the most likely issue? A1: This discrepancy often indicates a sub-population where the ARG is present but not expressed, or is present on a non-mobilizable element within non-viable cells. Culture selects for functional, expressed resistance in viable cells. Troubleshoot as follows:
- Check Cell Viability: Perform a live/dead stain (e.g., using propidium iodide) on your filter-mating or conjugation broth. High donor/recipient mortality reduces culturable outcomes.
- Assay Non-Culturable State: Use a viability dye (e.g., PMAxx) prior to DNA extraction for qPCR. If the qPCR signal diminishes, the ARG signal is coming from dead cells.
- Test Expression: Perform RT-qPCR on the mRNA of the ARG from the recipient cell pool to confirm if the gene is transcribed.
Q2: Metagenomic sequencing fails to detect a known plasmid-borne ARG transfer event confirmed by culture. What are the primary technical reasons? A2: This is typically a sensitivity (depth) and background noise issue.
- Insufficient Sequencing Depth: Low-frequency transfer events fall below the limit of detection. For a complex community, >50-100 million high-quality reads per sample may be needed to detect low-abundance transfers.
- High Host Genome Background: The recipient genome background can obscure plasmid mapping. Enrich plasmid DNA via kits (e.g., Qiagen Plasmid Mini) or halo-based methods prior to sequencing.
- Bioinformatic Stringency: Overly stringent read mapping or assembly parameters may discard chimeric reads spanning plasmid-host junctions. Re-analyze raw reads with specialized plasmid detection tools (e.g., plasmidSPAdes, MOB-suite).
Q3: When using droplet digital PCR (ddPCR) for absolute quantification of transferred ARGs, we observe high coefficient of variation (CV) between technical replicates. How can we improve precision? A3: High CV in ddPCR for environmental DNA often stems from inhibitor carryover or droplet heterogeneity.
- Purify DNA Extensively: Use inhibitor removal kits (e.g., Zymo OneStep PCR Inhibitor Removal Kit) or perform a silica-based column clean-up post-extraction.
- Optimize Droplet Generation: Ensure the droplet generator is clean and the sample is well-mixed but free of bubbles. Verify droplet integrity under a microscope.
- Adjust DNA Input: Too much or too little template DNA can affect Poisson distribution accuracy. Titrate input DNA (e.g., 1-100 ng) to find the optimal range where target concentrations are 100-1000 copies/20µL reaction.
Q4: For culture-based filter mating, the transfer frequency is erratic. What are the critical control points in the protocol? A4: Consistency is key. Follow this detailed protocol and controls:
Detailed Filter Mating Protocol for Low-Frequency ARG Transfer:
- Growth: Grow donor (with ARG) and recipient (with a counter-selectable marker, e.g., rifampicin resistance) to late exponential phase (OD600 ~0.8).
- Washing: Harvest cells by centrifugation (5,000 x g, 5 min). Wash pellets 3x in pre-warmed, non-selective buffer (e.g., 1X PBS or LB broth) to remove antibiotics.
- Mixing: Mix donor and recipient at a 1:10 ratio (e.g., 10^7 donors + 10^8 recipients) in a final volume of 1 mL. A 1:1 ratio control should be included for comparison.
- Filtration: Pass mixture through a sterile 0.22µm cellulose nitrate membrane filter. Place filter on pre-warmed, non-selective agar plate. Incubate upside down at mating temperature (e.g., 37°C) for 4-6 hours (optimize duration).
- Harvesting: Place filter in a tube with 5 mL of buffer/vortex to resuspend cells. Serially dilute and plate onto selective agar plates.
- Selection: Plate dilutions onto: a) Media selecting for recipient only (counts recipients), b) Media selecting for transconjugants (counts recipients that acquired the ARG), c) Media selecting for donor (counts donors).
- Calculation: Transfer Frequency = (Number of Transconjugants) / (Number of Recipients).
Critical Controls:
- Viability Check: Plate donor and recipient alone on selective media to confirm antibiotic efficacy.
- No-Donor Control: Plate recipient alone on transconjugant-selective media to confirm no spontaneous resistance.
- No-Recipient Control: Plate donor alone on transconjugant-selective media to confirm no donor carryover.
Quantitative Data Comparison of Platforms
Table 1: Comparison of Methodological Capabilities for Detecting Low-Frequency ARG Transfer
| Platform | Key Metric | Typical Limit of Detection (LOD) | Time to Result | Primary Advantage | Primary Limitation |
|---|---|---|---|---|---|
| Culture-Based | Transfer Frequency | 10^-7 - 10^-9 per recipient | 2-5 days | Confirms live, functional transfer | Bias against non-culturable/ stressed cells; low throughput. |
| qPCR/ddPCR | Gene Copy Number | ~0.1-1.0% of total DNA (qPCR); <0.01% (ddPCR) | Hours to 1 day | High sensitivity; quantitative; fast. | Does not confirm host location or functionality. |
| Metagenomic Seq | Relative Abundance | ~0.001% of community (varies with depth) | Days to weeks | Unbiased; detects novel ARGs/ hosts. | High cost; complex analysis; indirect evidence of transfer. |
| Hi-C / EpicPCR | Physical Linkage | Varies by method | Weeks | Confirms ARG-host linkage in complex samples. | Technically complex; specialized protocols. |
Research Reagent Solutions Toolkit
Table 2: Essential Reagents for Cross-Validation Experiments
| Reagent / Material | Function | Example Product / Note |
|---|---|---|
| Propidium Monoazide (PMAxx) | Viability dye for molecular assays. Binds DNA of dead cells, inhibiting PCR. | Distinguishes ARG signals from live vs. dead cells. |
| Mobilome Enrichment Kit | Selectively enriches plasmid/phage DNA. | Qiagen Plasmid Mini Kit, Norgen's Plasmid Purification Kit. Critical for sequencing. |
| ddPCR Supermix for Probes | Reagent mix optimized for droplet digital PCR. | Bio-Rad ddPCR Supermix for Probes (no dUTP). Provides precise, absolute quantification. |
| Chromosomal & Plasmid Tags | Fluorescent/antibiotic markers for donor/recipient. | GFP/RFP genes; neutral antibiotic resistance markers (e.g., kanamycin on chromosome). |
| Inhibitor Removal Technology | Removes humic acids, phenols from environmental DNA. | Zymo OneStep PCR Inhibitor Removal Kit, PowerClean Pro Cleanup Kit. Essential for reliable PCR. |
| Cellulose Nitrate Membrane Filters (0.22µm) | Surface for bacterial conjugation in filter mating assays. | Whatman, 0.22µm pore size, 25mm diameter. Provides close cell contact. |
Experimental Workflow & Pathway Diagrams
Diagram Title: Cross-Validation Workflow for ARG Transfer Research
Diagram Title: ARG Transfer Pathway & Detection Points
Cost-Benefit Analysis for Different Research and Development Applications
Technical Support Center: Troubleshooting Low-Frequency ARG Transfer Detection
FAQs & Troubleshooting Guides
Q1: During conjugation assays for detecting low-frequency ARG transfer, I observe no transconjugant growth. What are the primary points of failure? A: A systematic check is required.
- Donor/Recipient Viability: Confirm growth curves for both strains on selective media without antibiotics from the other strain's selection.
- Antibiotic Selection Efficacy: Verify the MIC for each antibiotic against the donor and recipient alone. Ensure the concentration used in selection plates completely inhibits the recipient but allows growth of transconjugants (donor with plasmid).
- Mating Conditions: Optimize mating time (often 2-18 hours), temperature (usually 37°C), and ratio (common start is 1:1 donor:recipient). Use a positive control plasmid with a known high transfer frequency.
- Plasmid Integrity in Donor: Re-isolate the plasmid from the donor and confirm its identity via restriction digest or PCR.
Q2: My qPCR assay for quantifying plasmid copy number (PCN) in potential transconjugants shows high variability and inconsistent results. How can I improve accuracy? A: This is critical for calculating transfer frequencies. Key steps:
- Standard Curve Dilution Series: Use a linearized plasmid or a gBlock fragment containing the target sequence. Create a 6-point, 10-fold dilution series in triplicate, spanning the expected copy number range (e.g., 10^1 to 10^6 copies/µL).
- Inhibit PCR Inhibition: Dilute template DNA (e.g., 1:10) or use a DNA cleanup kit. Include an internal positive control (IPC) in each reaction well to detect inhibition.
- Normalization: Always normalize your target gene (e.g., blaCTX-M) to a single-copy chromosomal reference gene (e.g., rpoB) in the host using the ΔΔCq method. This corrects for variations in DNA extraction efficiency and cell lysis.
Q3: When using fluorescent protein tags (e.g., GFP) to visualize transfer via microscopy, background fluorescence in the recipient is too high. How do I reduce noise? A: This compromises single-cell detection sensitivity.
- Strain Engineering: Use a recipient strain with all native fluorescent proteins (e.g., rfp, yfp) knocked out. Use a narrow-spectrum, fast-folding GFP variant (e.g., sfGFP) under a strong, constitutive promoter on the plasmid.
- Imaging Parameters: Increase laser/power intensity for the GFP channel while decreasing exposure time to reduce autofluorescence buildup. Use spectral unmixing or linear unmixing if your microscope has the capability to separate overlapping emission spectra.
- Controls: Always include an untagged plasmid in the donor as a negative control to set the background fluorescence threshold.
Q4: My long-read sequencing (e.g., Nanopore) of filter-mating products reveals a high rate of false-positive plasmid-recipient chromosome assemblies. How can I improve specificity? A: This is common in complex metagenomic-style samples.
- Pre-Sequencing Enrichment: Use recipient cells with an antibiotic marker to selectively isolate transconjugants before DNA extraction. Alternatively, perform plasmid-safe DNAse treatment to degrade linear chromosomal DNA, enriching for circular plasmid DNA.
- Bioinformatic Filtration: Apply stringent mapping criteria. Require that the plasmid contig has >95% coverage and >99% identity to the reference plasmid sequence and is circularized in the assembly graph. Discard any contig that also maps significantly to the recipient chromosome unless a specific integration site is being studied.
- Experimental Validation: Use PCR across suspected integration junctions from the sequencing data to confirm true chromosomal integration versus assembly artifact.
Table 1: Cost-Benefit Analysis of Key ARG Transfer Detection Methodologies
| Method | Approximate Cost per Sample (USD) | Time to Result | Theoretical Detection Limit (Transfer Frequency) | Key Advantage | Key Limitation |
|---|---|---|---|---|---|
| Classical Filter Mating + Plating | $50 - $150 | 2-4 days | ~10^-7 - 10^-8 | Gold standard, yields isolate for further study. | Low throughput, misses non-culturable transfers. |
| qPCR (Quantitative) | $100 - $300 | 1-2 days | ~10^-4 - 10^-5 | High-throughput, quantitative, culture-independent. | Cannot distinguish live transconjugants from naked DNA or dead cells. |
| Fluorescence-Activated Cell Sorting (FACS) | $400 - $800 | 1-2 days | ~10^-5 - 10^-6 | Single-cell resolution, can sort live transconjugants. | Requires robust fluorescent labeling; instrument access needed. |
| Microfluidic Droplet Digital PCR (ddPCR) | $200 - $500 | 1 day | ~10^-6 - 10^-7 | Absolute quantification without standard curve, partitions single cells. | High cost per sample, specialized equipment. |
| Long-Read Sequencing (Nanopore) | $500 - $1000+ | 1-3 days | Varies with enrichment | Reveals plasmid structure/context, mosaicisms. | High cost, complex bioinformatics, false assemblies. |
Experimental Protocols
Protocol 1: Optimized Filter Mating for Low-Frequency Conjugation Objective: To detect antibiotic resistance gene (ARG) transfer events occurring at frequencies as low as 10^-8. Materials: Donor strain (carrying plasmid with ARG and a selective marker, e.g., kanamycin resistance), Recipient strain (with a different selective marker, e.g., rifampicin resistance), LB broth, 0.22µm sterile mixed cellulose ester membrane filters, LB agar plates, selective LB agar plates (containing antibiotics to select for transconjugants: e.g., Rif + Kan, and to count donors and recipients). Method:
- Grow donor and recipient to mid-exponential phase (OD600 ~0.5-0.6).
- Mix 1mL of donor with 1mL of recipient culture. Pellet at 5,000 x g for 5 min. Resuspend in 100µL LB.
- Place the mixture onto a sterile filter on a pre-warmed LB agar plate. Incubate for 4-18 hours at optimal temperature (e.g., 37°C).
- Resuspend cells from the filter in 1mL LB. Perform serial dilutions (10^-1 to 10^-7).
- Plate appropriate dilutions on: a) Donor-selective plates, b) Recipient-selective plates, c) Transconjugant-selective plates (containing antibiotics that inhibit both donor and recipient but allow growth of cells that have received the plasmid).
- Incubate plates for 24-48 hours. Calculate transfer frequency: (CFU/mL of transconjugants) / (CFU/mL of recipients).
Protocol 2: ddPCR for Absolute Quantification of Plasmid Copy Number in Transconjugant Pools Objective: To absolutely quantify the number of target ARG copies in a mixed population post-mating without a standard curve. Materials: DNA extracted from mating mixture, ddPCR Supermix for Probes (No dUTP), target ARG assay (FAM-labeled, e.g., for blaNDM), single-copy reference gene assay (HEX-labeled, e.g., for rpoB), DG8 cartridge, QX200 Droplet Generator, QX200 Droplet Reader, PCR plate. Method:
- Prepare 20µL ddPCR reaction mix per sample: 10µL 2x Supermix, 1µL each of FAM and HEX assays (20x), 20-100ng template DNA, nuclease-free water.
- Generate droplets using the Droplet Generator following manufacturer's instructions.
- Perform PCR on a thermal cycler: 95°C for 10 min; 40 cycles of 94°C for 30s and 60°C for 60s; 98°C for 10 min; 4°C hold (ramp rate 2°C/s).
- Read plate on the Droplet Reader.
- Analyze using QuantaSoft software. The software calculates the concentration (copies/µL) of each target directly via Poisson statistics. Report the ratio of ARG copies to reference gene copies.
Visualizations
Low-Frequency Conjugation Troubleshooting Workflow
qPCR Normalization for Plasmid Copy Number
The Scientist's Toolkit: Research Reagent Solutions
Table 2: Essential Reagents for Low-Frequency ARG Transfer Research
| Item | Function & Application | Example/Notes |
|---|---|---|
| Chromosomal Tagging Systems | Labels recipient chromosome for differentiation from donor in mixed populations (e.g., for FACS, microscopy). | pUC18T-mini-Tn7T vectors for site-specific insertion of GFP/RFP into recipient's glmS site. |
| Mobilizable Reporter Plasmids | Positive control plasmids with known high transfer frequency and easy-to-detect markers (fluorescence, luminescence). | pKJK5 (IncP-1, gfp, lacI repressible) or RP4 (IncPα, broad host range). |
| Plasmid-Safe ATP-Dependent DNase | Degrades linear genomic DNA in lysates, enriching circular plasmid DNA for sequencing or transformation. | Epicentre Plasmid-Safe DNase, critical for reducing host DNA background in nanopore sequencing preps. |
| Droplet Digital PCR (ddPCR) Supermix | Enables absolute quantification of ARG and reference gene copies without a standard curve, crucial for low-abundance detection. | Bio-Rad ddPCR Supermix for Probes (No dUTP) for highest sensitivity and partition uniformity. |
| Bile Salts (e.g., Cholic Acid) | Used in mating media to simulate gut conditions, which can significantly upregulate conjugation machinery and increase transfer frequency for in vivo relevance. | Sodium cholate at physiological concentrations (0.1-0.4%). |
Reporting Guidelines for Ensuring Reproducibility and Data Sharing
Troubleshooting Guides & FAQs
Q1: My control plates show contamination, invalidating my conjugation assay for low-frequency ARG transfer. What are the most likely causes and solutions?
- A: Contamination typically stems from inadequate sterilization or airborne particulates.
- Cause 1: Improper filter sterilization of donor/recipient cultures. Ensure 0.22 µm filters are integrity-checked and solutions are filtered in a laminar flow hood.
- Cause 2: Aerosol generation during pipetting. Use filter-plugged pipette tips for all bacterial culture handling.
- Solution: Implement a strict negative control workflow: include a "recipient-only" control plate with the same volume of sterile PBS spotted where the donor culture would be. Repeat the assay using fresh, freshly sterilized antibiotics for selective plates.
Q2: I cannot detect any transconjugants on selective plates, despite spiking experiments confirming the assay should work. What should I check?
- A: This points to a failure in the conjugation event or excessive selection pressure.
- Check 1: Viability of donor and recipient strains. Re-test the growth curves and antibiotic susceptibility profiles (MIC) for both strains separately. A shift in recipient MIC can occur.
- Check 2: Antibiotic concentration in plates. Confirm the stock concentration, sterility, and final plate concentration. Perform a "lawn check" by plating the recipient strain on the transconjugant selection plate (e.g., Antibiotic A + Antibiotic B). No growth should occur, but if it does, the Antibiotic B concentration is too low.
- Check 3: Mating conditions. Ensure the mating time is sufficient (often 6-24h for low-frequency events) and the temperature is optimal for the bacterial strain and plasmid type (often 37°C, but some plasmids transfer better at 30°C).
Q3: My quantitative PCR (qPCR) data for plasmid copy number in transconjugants is highly variable. How can I improve reproducibility?
- A: High variability in qPCR often originates from template quality and normalization.
- Step 1: Standardize DNA extraction. Use a column-based kit designed for plasmid DNA, include an RNase step, and perform elution in nuclease-free water. Measure DNA concentration and purity (A260/A280 ~1.8) using a spectrophotometer.
- Step 2: Validate primer efficiency. For both the target ARG gene and the single-copy chromosomal reference gene, run a standard curve (10-fold serial dilutions of a known positive control). Efficiency must be between 90-110% for both assays.
- Step 3: Implement technical and biological replicates. Each sample should be run in triplicate (technical) from at least three independently isolated transconjugant colonies (biological).
Experimental Protocols
Protocol 1: Solid-Phase Agar Mating for Low-Frequency Conjugation Detection
Objective: To detect and quantify the transfer of an Antibiotic Resistance Gene (ARG) from a donor to a recipient strain at low frequencies (<10⁻⁶ per donor).
- Prepare Cultures: Grow donor (carrying plasmid-borne ARG, resistant to Antibiotic A) and recipient (chromosomally resistant to Antibiotic B) to late exponential phase (OD₆₀₀ ~0.8) in appropriate broth.
- Wash Cells: Pellet 1 mL of each culture separately at 8,000 x g for 2 min. Resuspend in 1 mL of sterile PBS. Repeat twice.
- Mix & Mate: Combine 100 µL of washed donor and 900 µL of washed recipient in a microcentrifuge tube. Gently mix. As a control, mix 100 µL of PBS with 900 µL of recipient.
- Spot on Agar: Pipette 100 µL of the mating mixture and 100 µL of the control mixture onto the center of separate, pre-warmed, non-selective nutrient agar plates. Let the spot dry.
- Incubate for Conjugation: Incubate plates upright at the optimal temperature (e.g., 37°C) for 16-24 hours.
- Harvest & Plate: Add 1 mL of PBS to the plate and resuspend the entire bacterial growth using a sterile spreader. Perform serial 10-fold dilutions in PBS.
- Plate appropriate dilutions on: a) Donor-selective media (Antibiotic A), b) Recipient-selective media (Antibiotic B), c) Transconjugant-selective media (Antibiotic A + Antibiotic B).
- Incubate & Count: Incubate plates for 24-48 hours. Count colonies. The conjugation frequency = (cfu/mL on transconjugant plates) / (cfu/mL on recipient plates).
Protocol 2: Plasmid DNA Extraction & qPCR for Copy Number Verification
Objective: To isolate plasmid DNA from transconjugants and quantify the relative copy number of the transferred ARG.
- Pick Colonies: Pick 3-5 isolated transconjugant colonies from selective plates. Grow individually in 5 mL broth with appropriate antibiotics overnight.
- Extract Plasmid DNA: Use a commercial plasmid miniprep kit. Include the optional RNase A step. Elute DNA in 50 µL nuclease-free water.
- Quantify DNA: Measure DNA concentration using a spectrophotometer.
- Prepare qPCR Reaction: For each sample, prepare a master mix containing:
- SYBR Green Master Mix: 10 µL
- Forward Primer (10 µM): 0.8 µL
- Reverse Primer (10 µM): 0.8 µL
- Nuclease-free water: 6.4 µL
- Template DNA (diluted to 5 ng/µL): 2 µL
- Total reaction volume: 20 µL.
- Prepare separate reactions for the target ARG and the single-copy reference gene (e.g., rpoB).
- Run qPCR Program:
- Stage 1: 95°C for 3 min (initial denaturation)
- Stage 2 (40 cycles): 95°C for 15 sec, 60°C for 30 sec (annealing/extension, acquire data)
- Stage 3: Melt curve analysis 65°C to 95°C, increment 0.5°C.
- Analyze Data: Use the comparative ΔΔCt method. Normalize the ARG Ct to the reference gene Ct for each sample. The relative copy number is calculated as 2^(-ΔΔCt).
Data Presentation
Table 1: Example Conjugation Frequency Data for Plasmid pEXAMPLE-ARG in E. coli Matings
| Mating Pair (Donor → Recipient) | Donor Titer (CFU/mL on Antibiotic A) | Recipient Titer (CFU/mL on Antibiotic B) | Transconjugant Titer (CFU/mL on A+B) | Conjugation Frequency (Transconjugant/Recipient) |
|---|---|---|---|---|
| EC123(pEXAMPLE) → EC456 | (4.2 ± 0.3) x 10⁸ | (1.1 ± 0.2) x 10⁹ | (5.5 ± 1.1) x 10¹ | (5.0 ± 1.2) x 10⁻⁸ |
| EC123(pEXAMPLE) → EC789 | (3.9 ± 0.4) x 10⁸ | (8.5 ± 0.7) x 10⁸ | 0* | <1.2 x 10⁻⁹ |
| EC456 → EC789 (Negative Control) | 0 | (9.0 ± 0.5) x 10⁸ | 0 | 0 |
*No colonies detected after plating 1 mL of undiluted mating mix.
Table 2: Key Reagent Solutions for Low-Frequency ARG Transfer Research
| Reagent/Material | Function/Brief Explanation | Critical Parameters |
|---|---|---|
| 0.22 µm PES Membrane Filters | Sterilization of antibiotic stocks and culture media without degradation. | Low protein binding; integrity test with pressure. |
| Filter-Plugged Sterile Pipette Tips | Prevents aerosol cross-contamination during pipetting of bacterial cultures. | Essential for all steps post-inoculation. |
| Antibiotic Stock Solutions | Selective pressure to isolate donor, recipient, and transconjugants. | Prepare in correct solvent (H₂O/EtOH), filter sterilize, aliquot, store at -20°C. Use validated, published concentration. |
| Synthatic Luria-Bertani (LB) Agar | Solid support for bacterial mating and selection. | Use defined, batch-controlled powder for reproducibility. Avoid heart infusion or tryptone variability. |
| Commercial Plasmid Miniprep Kit | High-purity, RNase-free plasmid isolation for downstream qPCR. | Columns must include an optional wash step to remove endotoxins/salts. |
| SYBR Green qPCR Master Mix | Sensitive detection and quantification of target DNA sequences. | Must be validated for efficiency (90-110%) with your primer sets. |
Mandatory Visualizations
Title: Solid-Phase Agar Mating Experimental Workflow
Title: qPCR Workflow for Plasmid Copy Number Analysis
Conclusion
Optimizing the detection of low-frequency ARG transfer is not merely a technical challenge but a fundamental necessity for accurately assessing the risk of antimicrobial resistance emergence. By integrating robust foundational knowledge with advanced, sensitive methodologies, researchers can move beyond the limitations of conventional assays. Systematic troubleshooting and rigorous comparative validation are paramount to generating reliable, actionable data. These advancements are critical for informing the development of novel antimicrobials and resistance-breaker adjuvants, improving environmental and clinical surveillance, and ultimately, preserving the efficacy of our antibiotic arsenal. Future directions must focus on developing standardized, high-throughput, and accessible platforms to make sensitive detection a routine practice in both research and clinical microbiology laboratories.